


According to our analysis of loss reserves published in mid-March, the year 2020 marked the 15th straight year that the U.S. property/casualty industry’s loss reserves developed favorably—by about $7 billion during 2020, or just slightly more than during 2019.
The “big news” we conveyed at Assured Research was that our reserve estimate for the industry moved to a significantly redundant reserve position at year-end 2020 (YE2020)—$28 billion, or 4 percent of carried reserves across the 10 most recent accident years. That’s a material change from our estimated reserve deficiency last year ($5 billion) and stems primarily from what we believe is a consistent and exceptionally conservative reserve position on the pandemic plagued accident-year 2020 (or AY2020) loss ratio across nearly every line of insurance.
What’s interesting is that much of our estimated reserve redundancy comes from short(er)-tailed lines of insurance (e.g., private passenger auto). So, our major change in reserve position may not have overarching cycle ramifications as it would first seem. Instead, we see different storylines developing for each line of insurance and suspect the pricing cycle could morph during 2021 from an overarching hard market into one that is nuanced by line of insurance.
 The Assured Research report revealing a $28 billion redundancy is titled “Assured Industry Study | 2020 Industry Reserve Analysis: Conservatism will influence pricing cycle,” published March 15, 2021.
In last year’s report, “Assured Industry Study | 2019 Industry Reserve Analysis: Reserves turn deficient,” published March 17, 2020, the authors revealed roughly a $5 billion deficiency. While the number representing 1 percent of carried reserves was not material, the deficiency was a notable change from prior years.
Both the 2019 and 2020 reports break down the results by line of business and comment on the pricing implications of the reserve positions.
Both analyses cover the most recent 10 accident years only. Legacy liabilities from prior years are not considered.
As most industry professionals realize, the loss reserving and pricing cycles are inextricably interlinked. In this article, we share our views on the relationship between loss reserves and the pricing cycle for three long-tailed lines of insurance: workers compensation, commercial auto liability and general liability-occurrence. (Readers interested to learn more can contact us through our website at http://assuredresearch.com/contact-us/)
The Big Picture
Before getting to those lines of business, we’ll start with a few big-picture observations from our study. First, the diagonals across most triangles showed some disruption, but they weren’t busted as we had anticipated at the outset of the pandemic and wrote in these pages one year ago. (Related article: “COVID-19: On Disrupted Diagonals and Lengthening Tails) Instead, calendar-year 2020 claim activity continued across most older years and lines of insurance. Claims adjusters may have been working from home in 2020, but they weren’t sitting on their hands.
Next, the real story of this reserve analysis rests with the selection of the AY2020 ultimate loss ratio. Based on our work, 41 percent of our estimated reserve redundancy of $28 billion comes from AY2020. Interestingly, several of those lines are shorter-tailed and our differences from the industry will be proven right, or wrong, and probably by the middle of 2021. It’s true, for instance, that surging inflation on lumber, wiring, paint and other raw materials used to settle property claims could make the industry’s conservative stance seem prescient, not excessive. But in our report, we show the industry’s selected ultimate loss ratio for some of the lines generating the largest redundancies will need to show an historic level of reserve development in order to rise to the industry’s conservative position.
The development on the special property line (which is dominated by auto physical damage) provides a nice illustration. From its 12-month value, the industry’s reported loss ratio has risen, on average, by a factor of 1.07-times to its ultimate value for prior accident years. That metric, which was measured over the past decade, is forecasted to be 1.15-times for AY2020—more than twice the typical upward development. That might not seem like a big difference, but when applied to a base of nearly $100 billion of losses, the dollars add up fast.
And while most financial types, like us, see conservatism as incrementally positive, we’re not so sure state insurance regulators (many already frustrated with the outsized pandemic profits booked by some auto insurers) will agree. If regulators see auto insurers releasing material levels of reserves during the first half of 2021, it seems likely they’ll sharpen their pencils when reviewing requests for rate increases as the economy—and driving—rebounds this year.
Pricing Cycles in Longer-Tailed Lines
Let’s turn our attention to three longer-tailed lines of insurance where our reserving work may provide insight to the evolution of the pricing cycle for each line.
Workers Compensation: Still Redundant
In workers compensation, our reserve redundancy continues to grow.
We forecast a $13.3 billion redundancy at YE2020—which is a big number, of course—but we’ll note that the industry has released an average of nearly $7 billion from this line over each of the past three years.
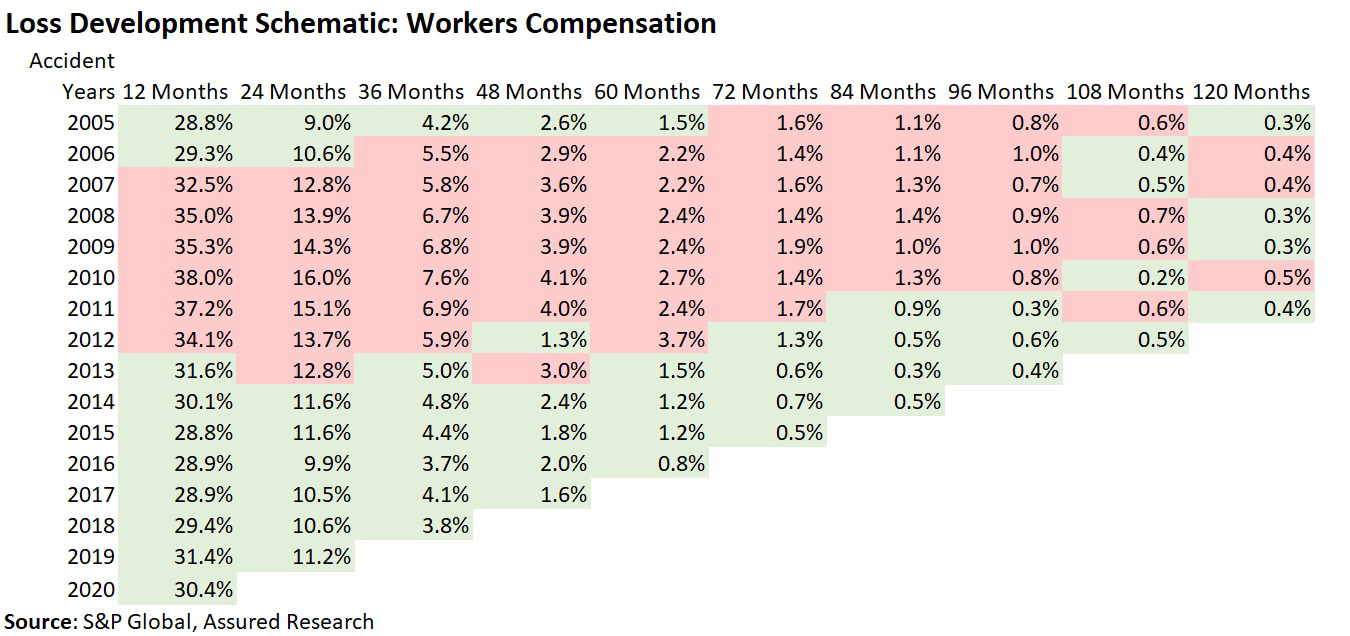
In the accompanying figure, the incremental, reported loss ratio (that is, paid + case reserves, no IBNR) is shown down each column, or year of loss development. A cell is green where the loss ratio is less than the column average (i.e., less loss ratio development = good) or red where it is above the average. An actuary would like to see a random pattern to indicate there are no systemic underlying changes, such as from an accelerating loss trend.
For workers comp, there is lots of green, and as most will know that comports with favorable workers comp loss trends for much of the past decade.
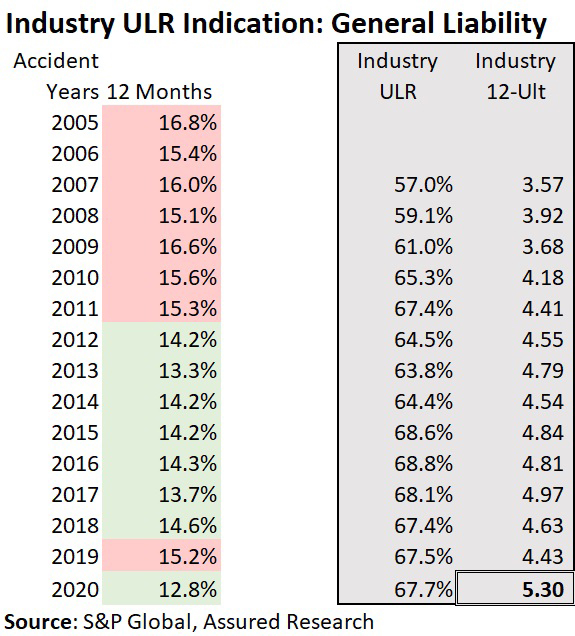
Below, we focus on just the first column of the triangle, showing the reported loss ratio for each accident year through 12 months.
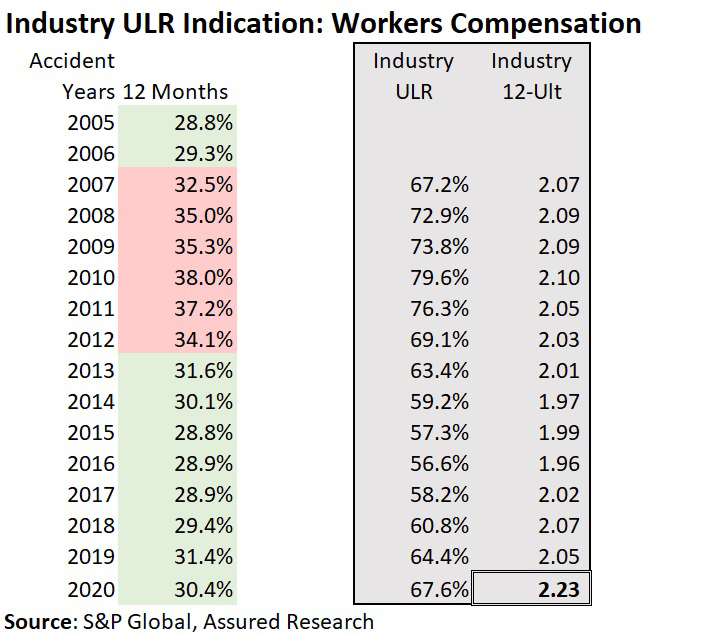
In the gray box to the right, we show the industry’s booked ultimate loss ratio (ULR) by accident year and the implied development factor to move the 12-month reported loss ratio to its ultimate value (e.g., for AY2020, 67.6/30.4 = 2.23).
The slight downtick in the AY2020 loss ratio (30.4 vs. 31.4 for AY2019 at 12-months) shows that the decline in claims from the slowed economy outweighed new COVID claims despite lots of handwringing by industry analysts and other pundits over COVID-presumption laws.
Will AY2020 losses develop upward by a factor of 2.23-times—higher than any earlier year? We’re skeptical.
Workers Comp Pricing Cycle Ramifications
A recent study published by the NCCI forecasts an 86 combined ratio for AY2020, just one point higher than the 85 for 2019. With a combined ratio that low, more favorable reserve development and (we can all hope) the quick disappearance of most COVID workers comp claims (since health care workers—the largest source of COVID workers comp claims—will have been vaccinated for much of 2021), we think rates are likely to drift lower. It will probably take a dramatic reacceleration of the economy and rising claim counts to reverse that trend.
Commercial Auto: A $0.7B Deficiency
It’s been a long time coming: Commercial auto is finally looking better!
At YE2019, we estimated a $4 billion reserve shortfall on this line, and the industry experienced $2 billion of adverse development during calendar-year 2020. (That’s been the average for the past three years). But with continued rate increases, and with some help from the pandemic, it looks like this line is finally turning the corner.
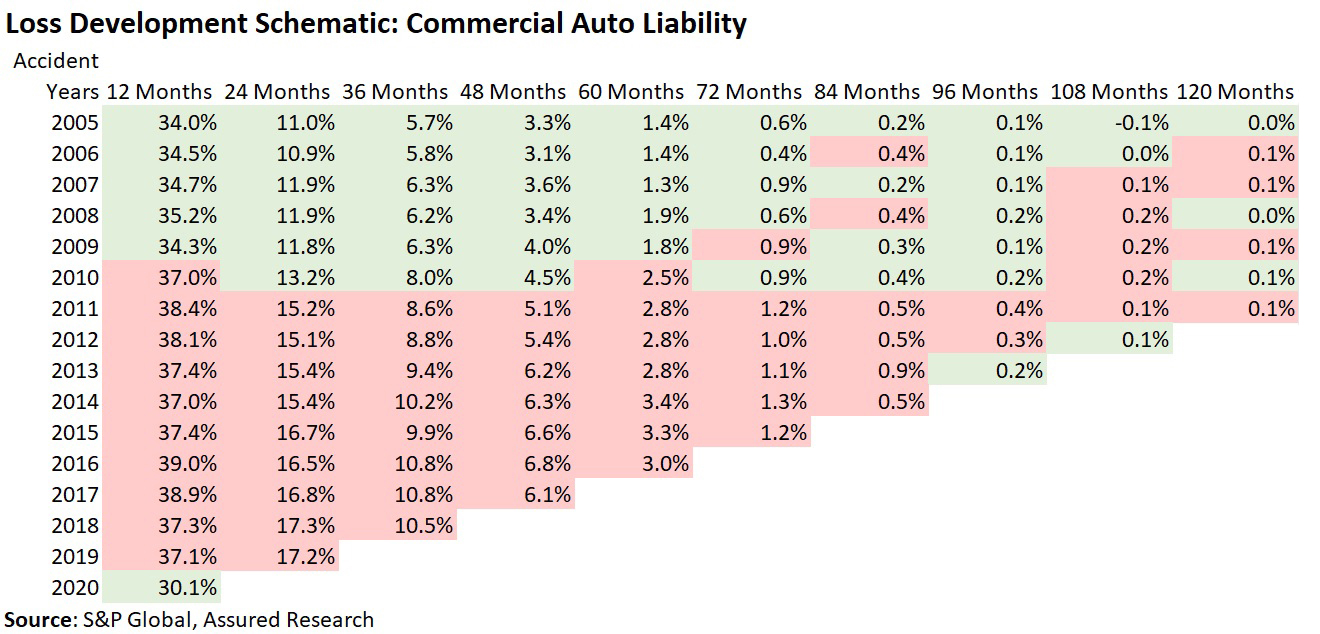
The accompanying triangle shows that two dynamics can coexist:
- Inflationary pressures continue to adversely impact older, presumably more severe claims along the diagonal of the triangle. In a recent report, we researched trends in traumatic brain injuries; they’re being added to many severe commercial auto claims and probably helping to keep the diagonal shaded red.
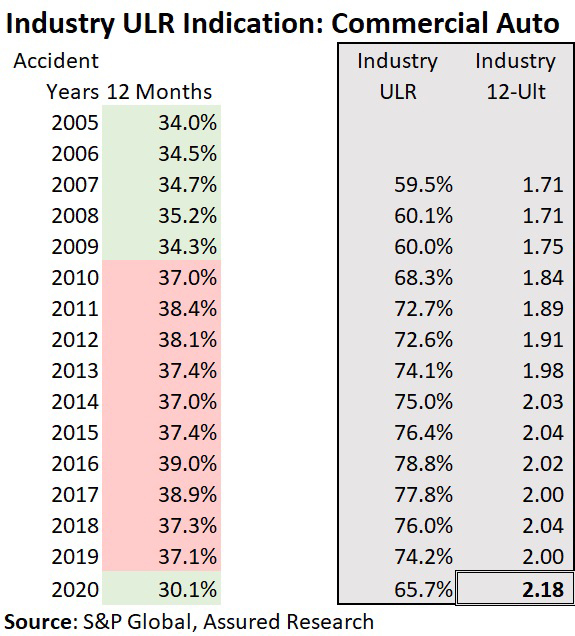
- At the same time, the AY2020 loss ratio is green. Commercial trucks were on the road during 2020, but there were far fewer personal autos to collide with. Note the decline from 2019 and prior years at 12 months—and the implied development for a selected ultimate loss ratio that’s lower than any for the last 10 years in the table below.
Our forecast calls for decelerating rate increases in 2021. Said another way, the second derivative of rate increases turns negative.
The spoiler: an accelerating economy, more crashes and nuclear verdicts.
Other Liability Occurrence (aka General Liability): A $4.5B Deficiency
This line marks the largest change from our work one year ago. At that time, we estimated a $16 billion deficiency, and indeed $3.6 billion of adverse development came through the income statement. But we did lower our ultimate loss ratios from last year’s study—partly due to a methodology change and partly because of lower claim activity.
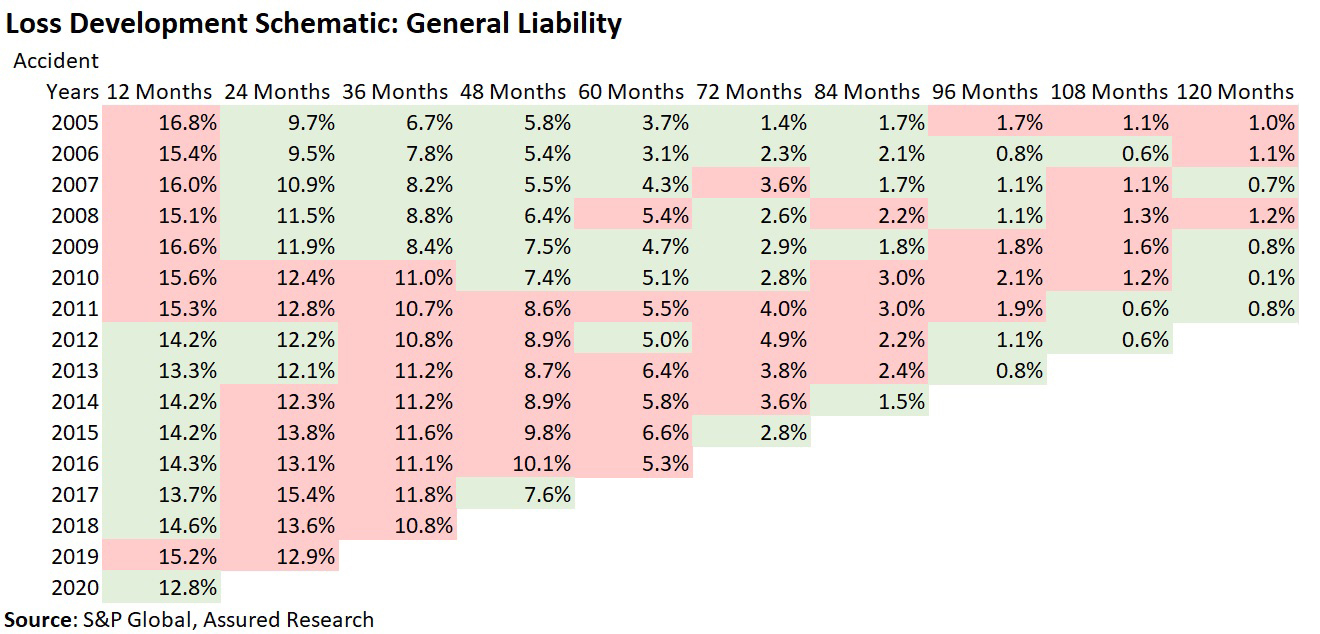
Last year, the diagonal of the loss ratio development triangle for general liability was almost entirely red. Now we begin to see some green light. Perhaps this line was particularly impacted by the closed courts and activity and developments on claims—new and old—will begin to rise again during 2021?
That seems to be what the industry is betting on with an implied 12-ultimate development factor of 5.3-times—higher than even the oft-cited poorly underwritten and priced years of 2015-2018.
Exercising a bit of hyperbole, we’ve said that favorable reserve development on AY2020 in general liability will be the death knell of the pricing cycle. There is some truth to that, we think, but here time is on the industry’s side. With valid concerns over a reacceleration of social inflation, the earliest that (most) insurers may feel pressure to lower loss reserves on AY2020 will be with YE21 reserve studies.
Our forecast: rising liability rates throughout 2021, although we suspect the pace of rate increases will plateau this year.
Story Lines Develop
Loss reserving and pricing cycles are inextricably interlinked. And while we think the industry maintains a conservative reserving position overall, we see different storylines developing for each line of insurance.
As a result, we suspect the pricing cycle could morph during 2021 from an overarching hard market into one that is nuanced by line of insurance.
 20,000 AI Users at Travelers Prep for Innovation 2.0; Claims Call Centers Cut
  Nearly 26.2M Workers Are Expected to Miss Work on Super Bowl Monday
  What Analysts Are Saying About the 2026 P/C Insurance Market
  Insurance Groundhogs Warming Up to Market Changes