


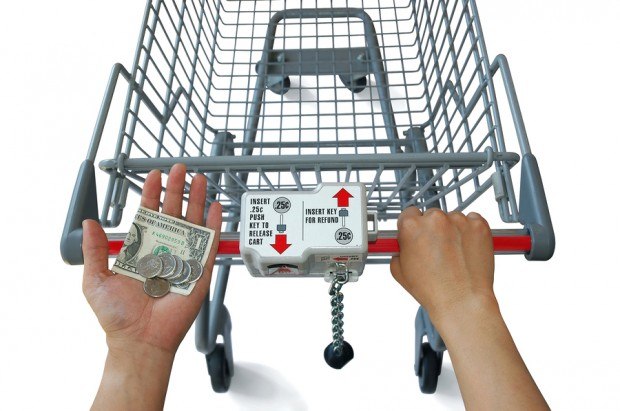
If supermarket chains wanted to get in the business of selling property/casualty insurance, there is a source of consumer information they might tap to identify the best risks that most P/C actuaries haven’t considered.
Executive Summary
Recognizing that the predictive power of credit data lies in the fact that it’s essentially behavioral data, Deloitte’s James Guszcza suggests that the barcode data from groceries might also be useful for insurers in assessing accident potential of individuals. During a recent actuarial meeting, Guszcza and Aon’s Stephen Mildenhall reviewed the basics of big data, the potential uses and pitfalls, as well as the implications for actuaries.It’s supermarket scanner data, according to James Guszcza, an actuary and chief data scientist for Deloitte Consulting in the U.S., who explained why such data is relevant at the Casualty Actuarial Society’s annual meeting last week, during a session titled “Big Data: What It Is and What It Means for the Insurance Industry.”
First going through several examples of big data that seemed to suggest a diminished role for actuaries in the future, Guszcza came full circle during his talk, ultimately advancing the idea that big data is essentially behavioral data, which actuaries can analyze.
In fact, they do already, he said, giving the example of credit data. Credit data has been used since the early 1960s to figure out who is going to default on a loan. Thirty or 40 years later, insurers picked up on that and realized that credit data is also highly predictive of who is going to crash their car.
Guszcza recalled being perplexed by that connection when he was working on his first data project for the Allstate Research Center in a position he had prior to his role at Deloitte. “Why would this be the case?”
“It’s because credit data is behavioral data,” he said, answering his own question. “It’s a proxy for the underlying behavioral traits that also cause people to have auto accidents. Otherwise it wouldn’t be as predictive as it is.
“It’s hugely predictive. It’s one of the great innovations in insurance in the 1990s.”
 Turning his attention to supermarket scanner data, Guszcza noted that the University of Chicago pioneered the analysis of supermarket scanner data to measure consumer demand elasticities (responsiveness to price changes) and to plan discount offers and changes in grocery product displays.
“What if supermarkets started selling insurance? Couldn’t they use that as another form of behavioral data like credit data,” Guszcza wondered. It may be the case that green tea buyers will have fewer accidents than those who buy beer. Or perhaps “people who buy health foods are going to have fewer accidents than people who eat a lot of junk food.”
“It turns out that’s for real,” Guszcza said, noting that 10 years after coming to understand the behavioral link between credit data and insurance losses, he saw firsthand evidence that “supermarket scanner data does, in fact, predict who is going to crash their car or submit a homeowners claim.” He confirmed the hypothesis during the course of his consulting work at Deloitte, he said.
The actuary, who during his talk periodically cited some of the work of people who he referred to as leading thinkers on big data trends, shared this excerpt of a published interview with MIT Professor Sandy Pentland to underscore his thesis. Pentland says:
“The power of big data is that it is information about people’s behavior instead of information about their beliefs… This sort of big data comes from things like location data off of your cell phone or credit card. It’s the little data breadcrumbs that you leave behind you as you move around in the world.
…those breadcrumbs tell… the story of your life… Big data is increasingly about real behavior, and by analyzing this sort of data, scientists can tell an enormous amount about you. They can tell whether you are the sort of person who will pay back loans. They can tell you if you’re likely to get diabetes.”
Source: “Reinventing Society in the Wake of Big Data,” published on edge.org (Aug. 30, 2012)
“I have used big data for both of those applications,” Guszcza said.
More Predictive, Less Insurable?
Picking up on the theme of “digital breadcrumbs,” Stephen Mildenhall, Global CEO of Analytics at the Aon Center for Innovation and Analytics, reminded actuaries in attendance of the breadcrumbs they left on the way to the meeting—purchasing airline tickets over the Internet with their credit cards, accumulating points for hotel membership clubs and using smartphones that tracked their locations at every moment in time.
Mildenhall discussed the associated privacy issues and also the idea that as data becomes more and more predictive, insurability may be reduced. “As actuaries, we have to be careful what we wish for,” he said, illustrating the latter point with a slide showing three sets of 1,000 colored dots scattered throughout a grid of 25 square sections.
The first set had mostly blue dots and 40 red-colored “claim dots” occurring randomly among the 25 boxes. “This is a traditional insurance situation. The premium of the many is going to pay for the claims of the few,” he said. The array was meant to depict a 4 percent frequency. “It’s a beautifully insurable situation.”
As a result of doing a big data analysis, an actuary might instead end up in a situation illustrated by a second array of dots—this one with all the “claim dots” isolated in one section in a lower left-hand box. Here, the actuary can “actually isolate what are the drivers of loss,” he said, assuming the frequency of loss in that lower left-hand corner is 50 percent.
In that situation, “we may still have an insurance market, [but] we’re getting on the edge of whether this would continue to exist as an insurable market,” Mildenhall said, suggesting that this is similar to a flood insurance situation.
“Flood is a great big data example,” he added, noting that data about elevation, geocode locations, meteorological data and river gauge data can all feed into a flood insurance analysis.
Showing one more array, with every one of the dots in the lower left-hand corner colored red to indicate claim potential, he said, “Taken to an extreme,…we have identified all of the people that have a claim.
“Here, you no longer have an insurable market,” he said, noting that while the example is far-fetched for the world of P/C insurance, “in health insurance, it absolutely isn’t.” Having a certain genetic marker means “you will absolutely get a disease unless you’re killed in an accident beforehand.”
Mildenhall and Guszcza also spent time talking about the privacy issues associated with the massive amounts of data breadcrumbs being collected about individuals on a daily basis and the inferences that can be drawn from them.
 Mildenhall recalled the plot of the movie “Minority Report”—a film in which so-called “precogs,” or humans with precognitive abilities, could see crimes that were going to happen in the future, allowing a police crime force to arrest would-be perpetrators. “We’re obviously not there yet, but we’re getting close to some creepy aspects of the data we have and the predictions that we’re able to make from it today,” he said.
As actuaries and other data analysts think about protocols for safeguarding privacy, they need to understand that “data lives forever,” he added. An individual may give consent for personal data to be used for a particular purpose, “but what happens down the road? What happens with that credit information when 30 years down the road we discover it’s predictive for auto losses?”
“It’s really going to turn the privacy challenge into one where we need to be putting the onus on users of data…to use it responsibly rather than the person giving consent,” he said, noting that when individuals give consent they have no way of knowing what the data might be used for in the future—or what predictive links might be discovered.
Guszcza sees an opportunity in the “tug of war between people and companies” over sharing data breadcrumbs. He suggested that if insurers create value for customers, they will be willing to give up privacy.
What might insurers offer of value in return?
Connecting the dots between big data and behavior again, he suggested they could offer insureds information—through digital media—about behaviors they can correct to lower their risk.
Using the example of telematics data, he asked: “What if you could give people behavioral nudges that say, ‘Did you know that your driving behavior is riskier than 90 percent of your peer group?'”
Guszcza went on to state that it has been shown through behavioral economics studies that telling people that they consume more electricity than 90 percent of their neighbors spurs more action to reduce consumption than reminders about climate change.
Correlation Isn’t Everything
“Is it possible for us to take a page from the Netflix book and create new products?” he asked, referring to an often-cited example of how Netflix used big data to create the television series “House of Cards.”
Guszcza began the session with other examples of big data in action that are more relevant to insurers, including a predictive model built by New York City data scientists to guide building inspectors to the riskiest buildings.
The model, which used data from crime reports, rodent reports, ambulance reports and other sources, rank-ordered 900,000 building lots based on riskiness, he said, citing an account from the book “Big Data: a revolution that will transform how we live, work, and think.” The book’s author, Ken Cukier, reported that before using the model, 13 percent of inspections resulted in a vacate order. Using the model, inspectors issued vacate orders for 70 percent of inspections.
 A second example is “Google Flu Trends”—essentially Google’s use of search terms like “feeling sick,” “flu” and “visiting a doctor” to map out the progression of flu cases around the globe faster than the Centers for Disease Control and Prevention (according to an article in Nature magazine five years ago).
Moving on to another example of big data from Google, Guszcza described Google Translate. Here, he noted that the foundation of the Google Translate model is very different from the work of actuaries or the predictive modelers of the City of New York. To tackle the problem of machine translation, Google did not start with linguistic principles or probability models. Instead, “it basically is brute force looking for associations between documents that have already been translated—English into Polish, Polish into Indonesian, whatever.”
Citing an article co-authored by Peter Norvig, a Google research director, titled “The Unreasonable Effectiveness of Data,” Guszcza said the idea expressed in the article (and underlying the Google translation process) “is that we don’t have better models. We have better data …The data is so big now that we can do an end-run around traditional methodology” and just let the data speak for itself.
“It’s just the correlations. That’s all we need.”
Stated another way, Guszcza quote Wired magazine editor Craig Anderson:
“Petabytes allow us to say: ‘Correlation is enough.’ We can stop looking for models. We can analyze the data without hypotheses about what it might show. We can throw the numbers into the biggest computing clusters the world has ever seen and let statistical algorithms find patterns where science cannot.”
Source: “The End of Theory: The Data Deluge Makes the Scientific Method Obsolete,” Wired magazine, June 23, 2008
Translation: “In other words, no more statistics, no more actuarial science. We just need engineering,” Guszcza said.
But correlation actually isn’t enough, he reported, going back to the Google Flu Trends example, noting that it overpredicted the CDC estimates by a factor two last factor and had been predicting too high for 100 out of 108 weeks before that. The authors of an article in Science magazine (“The Parable of Google Flu: Traps in Big Data Analysis,” March 2014, by David Lazer, Ryan Kennedy, Gary King, Alessandro Vespignoni) offer two diagnoses—”algorithmic dynamics” and “big data hubris,” Guszcza noted.
Algorithmic dynamics refers to the fact that after Google went live with Google Flu Trends, the search algorithm changed. “Google continually updates its search engine because that’s its core business—to make people’s searches more relevant.” But as the engine changed, search behavior changed too, but the algorithm was not changing over time.
“Just imagine doing loss reserving and not paying attention to changes in the mix of business or [claim-handling] practices,” he said, providing a relatable example for fellow actuaries.
Big data hubris is defined as “the often implicit assumption that big data is a substitute for, rather than a supplement to, traditional data collection and analysis,” he said.
Providing a more classic example, Guszcza recalled the famous Gallop poll prediction of Dewey defeating Truman in a presidential election, noting that the survey was conducted by telephone at a time when people who owned telephones were more likely to vote Republican.
There’s a failure to recognize the process that generated the data. “The data itself wasn’t enough,” he said.
“There are these pitfalls in the analysis of big data. I don’t think actuarial science is over just yet,” he concluded.
Reading List
 During their presentation, Guszcza and Mildenhall referenced the following sources for more information on big data trends.
Articles:
“The Unreasonable Effectiveness of Data” by Fernando Pereira, Alon Halevy, Peter Norvig (Google).
“The End of Theory: The Data Deluge Makes the Scientific Method Obsolete” by Craig Anderson, Wired magazine, June 23, 2008.
“The Parable of Google Flu: Traps in Big Data Analysis” by David Lazer, Ryan Kennedy, Gary King, Alessandro Vespignoni, Science magazine, March 2014.
“Reinventing Society in the Wake of Big Data,” published on edge.org (Aug. 30, 2012).
Books:
“Social Physics: How Good Ideas Spread—The Lessons of New Science” by Alex Pentland.
“The Elements of Statistical Learning: Data Mining, Inference, and Prediction” by Trevor Hastie, Robert Tibshirani and Jerome Friedman.
 Experts Say It’s Difficult to Tie AI to Layoffs
  Flood Risk Misconceptions Drive Underinsurance: Chubb
  Berkshire-owned Utility Urges Oregon Appeals Court to Limit Wildfire Damages
  RLI Inks 30th Straight Full-Year Underwriting Profit


