


The three property/casualty venture-backed U.S. InsurTech startups—Lemonade, Metromile and Root—finished 2018 with pretty good results. Quarterly growth was the slowest ever, but all three paid out less claims dollars than they collected in premiums.
Still, all three startup carriers have more work to do to achieve sustainable financials.
A year ago, when my friend Adrian Jones joined me in starting a public conversation about InsurTech statutory results, the picture was ugly: loss ratios well over 100, an aggressive focus on price, and promotional messages on company blogs that dismissed traditional measures of success in insurance.
Since the first post titled “Five Dispatches from InsurTech Survival Island,” the conversation has shifted dramatically. Fast forward a year, and one founder said he “messed up an entire quarter” because premium growth turned negative, when in fact the company generated its best quarterly loss ratio ever. In the intervening months, several startups have hired top underwriting talent from their traditional competitors, showing that they increasingly recognize the value of traditional insurance skills.
Skeptics point out that a quarter doesn’t mean much, there’s a long way to go before reaching sustainability and each additional point of loss gets harder to take out. True, but the increased focus this year on reducing losses and increasing prices is making a difference.
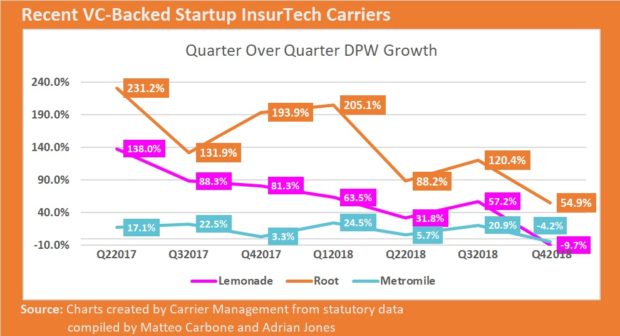
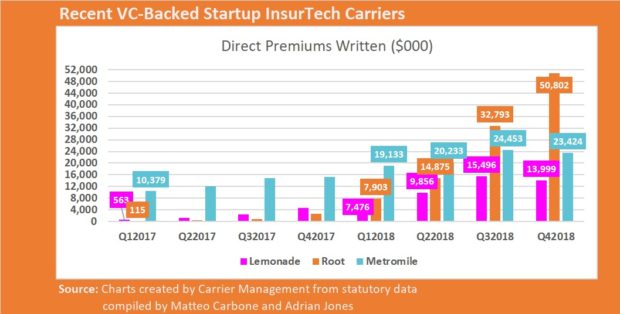
Here are the quarterly results:

I think—as already mentioned in the previous articles—these companies have strong management teams who could ultimately create valuable businesses. This will take several years, but all three companies are well-funded, even if the combination of statutory capital injections and operating losses consumes tens of millions in capital each year. (The Uber/Lyft model of growing rapidly while also incurring large losses is doubly penalized in insurance since carriers have to maintain statutory capital that increases with premium.)
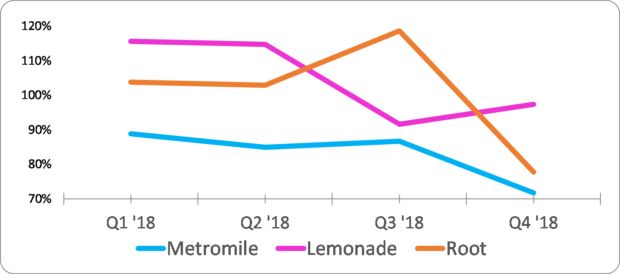
Here is a year-over-year comparison.

The three companies have sold in the last 12 months between $40 million and $110 million, less than some of the early 2017 enthusiastic forecasts that Lemonade (for example) would hit $90 million premiums by the end of 2017. In auto, I pointed out at my IoT Insurance Observatory plenary sessions that the pay-as-you-drive telematics approach seems to attract only the niche of customers that rarely use cars—maybe a growing niche but not a billion-dollar business (in premiums at least).
Top Lines
In the last article of last year’s series on InsurTech carrier financial results, we told the story of top-line figures with comparisons to ants and grasshoppers. Both Lemonade and Metromile have showed a contraction in quarterly written premium volume for the first time in the past two years. Root has slowed down, but this grasshopper keeps hopping with a remarkable 55 percent quarterly growth rate for the fourth quarter.
Real and ‘Exotic’ Loss Ratios
Loss ratios for 2018 were all below 100, which is a great improvement from the 2017 performances of the three carriers. The quarterly dynamics show a positive trend, but these loss ratio levels are far from the U.S. market average for home insurance (Lemonade) and auto insurance (Root and Metromile).
I talk here about loss ratio—a fundamental insurance number—which is how much does an insurer have in claims divided by their premiums. Easy? Not always.
I’ve already heard someone ask how to normalize/adjust the loss ratio of a fast-growing InsurTech company.
What’s in a Loss Ratio?
Imagine a fast-growing insurer with the following annual figures:
- Premiums written: $10 million
- Premiums earned: $6 million
- Claims paid: $2 million
- Losses incurred but unpaid: $5 million
Any of the following numbers might be called a “loss ratio”:
- Claims paid divided by premiums written: 20
- Claims paid divided by premiums earned: 33
- Claims paid and unpaid incurred losses divided by premiums written: 70
- Claims paid and unpaid losses incurred divided by premiums earned: 117
The least attractive is the right one.
Claims paid and unpaid losses incurred divided by premiums earned is the loss ratio, for a fast-growing startup as for a large incumbent.
The others are only “exotic loss ratios.”
I’ve already heard people who say that accounting rules cause the loss ratio to be overstated based on the following unlucky scenario. A one-year homeowners policy sold for $730, earning $2 of premium each day. If a $100 claim (net of the deductible) is received on that first day, the loss ratio is 5,000 percent. That’s how it works, but is it overstated? Well, as long as premium is being earned, more claims could arrive, and the loss ratio could go even higher still. Obviously you expect the following 364 days to be less unlucky for this portfolio.
I don’t think there is any need to adjust that loss ratio…only to know that it is not (statistically) relevant.
However, the analyzed startups have portfolios of more than 100,000 policies. So, bad luck can’t explain eventual unfavorable loss ratios.
It could be that some approaches are specially targeted for fraud, and it only takes a few fraudsters to cause big problems in the loss ratio on a small book, as the above illustration shows. Some startups have advertised how quickly they pay claims, sometimes not even having a human review them, which invites unsavory people to pay a small amount to start a policy and then “lose” a valuable item. Early on, when less premium has been earned, this fraud is particularly impactful on the loss ratio. Over time, in a bigger and more balanced book, fraud gets tempered by the law of large numbers.
Additionally, some startups have offered large new business discounts. If they can retain customers reducing the premium leakage, their second-year loss ratios should be more reasonable, but the overall loss ratio will be elevated for however long they are acquiring new customers with aggressive discounts.
Expense Ratios
I would love to discuss also the other lines of the income statements, but unfortunately they are not meaningful nor comparable anymore, since companies now move expenses among their entities not represented in the yellow books. The cost amounts represented in the yellow books are only a part of the real costs necessary to run the insurance business.
The statutory information I’m commenting on is reported only for insurance companies—not agencies, brokers or service companies. The term “insurance company” or “insurer” has a very specific meaning: “the person who undertakes to indemnify another by insurance.” Within an insurance holding company, it is typical to have an insurer and an affiliated agency, and sometimes other affiliates such as a claims administrator. The insurer pays the agency to produce policies. This may feel like moving money from one pocket to another, but there would be reasons for it which I won’t get into now.
The point is for commentators and investors to be aware. If an insurer (for whom the public receives financial data) pays an affiliate 25 percent of its premiums to provide certain services, then the insurer’s expenses (which are reported in the yellow book) are set at (or close to) 25 percent of their premiums, regardless of what they actually are.
Major investors are typically privy to large amounts of information and can disentangle the back-and-forth between the insurer, agency and holding company. For smaller investors, or those who simply pick up a statutory filing, it is easy to be misled.
At the beginning of 2018, Lemonade was no longer consolidating its parent and affiliate expenses into Lemonade Insurance Co., its statutory entity. Lemonade’s CEO commented on our article that this was at the request of their home state regulator. Root followed suit Oct. 1, 2018, so the fourth-quarter 2018 expense ratio moved to 28 from the 70 in the third quarter. So, the “new” expense ratios (and therefore combined ratios) are artificial and not comparable to the previous ones or to competitors.
While regulators may have reasons for their actions, it is better for students of insurance innovation to know the full, real financials, so as to determine if the startups are ever able to “walk the talk” of better expense efficiency from “being built on a digital substrate.”
Unfortunately, bloggers are not the main audience of statutory filings. Nonetheless, innovation cheerleaders, investors and journalists…please pay attention to these accounting differences before commenting the performances.
 Self-Driving Car Firms Must Address Emergency Vehicle Interference
  U.S. P/C Industry Books Best Result in a Decade, but Not All Lines Enjoy Success
  Reframing Like a Fox: How Insurance Leaders Can Catch Strategic Drift Before It Compounds
  Executives on the Move at SiriusPoint, Canopius Group, Badger Mutual