















If there is a bright side to the tumultuous ride that was 2020, it’s the surprisingly agile turn property insurers took to move away from traditional reactive approaches toward more proactive customer experiences.
Executive Summary
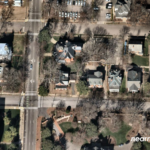
With use cases of geospatial imagery and analytics expanding from claims response to upfront underwriting and pricing, the job of curating data and matching individual images to specific properties being assessed probably isn’t a do-it-yourself exercise, according to representatives of two geospatial analytics vendors who help insurers make sense of the visual information increasingly available from manned aircraft and satellites.At the center of this change is the drive in demand for aerial and satellite imagery.
At the onset of its introduction into the property/casualty sector, geospatial imagery typically was procured after catastrophe losses. The imagery provided a way for property carriers to analyze large swaths of damaged properties in a short amount of time, leading to faster claims resolution. Fast forward to the present, and geospatial imagery is being tapped by a variety of departments, including underwriting and risk management, in addition to claims.
According to Neil Pearson, chief strategy officer for Chicago-based Arturo, a spinoff of an American Family Insurance research and development initiative, gone are the days of an agent completing a labor-intensive questionnaire about a property with the insured’s assistance to secure property coverage.
 “We identify the types of risk, the concentration, the propensity so that they [carriers] can better price the target customer, as well as understand the personas within the customer base.”
Neil Pearson, Arturo
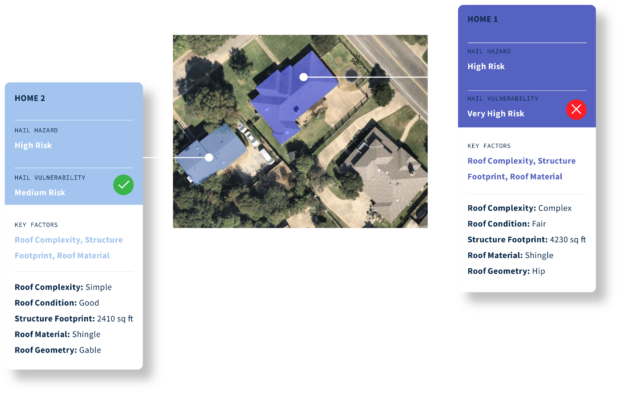
Geospatial imagery offers the ability to create a knowledge base in and around a property, Pearson said. In the past, carriers traditionally relied on a variety of resources to develop an aggregate risk score. “With artificial intelligence (AI) and machine learning technologies, we can tell you what is wrong with that home, what the insurance risks around that home are with a confidence score in the high 80s, up to the early 90s,” he added.
“We identify the types of risk, the concentration, the propensity so that they [carriers] can better price the target customer, as well as understand the personas within the customer base,” Pearson said.
California-based Cape Analytics, founded in 2014, began using computer vision and machine learning algorithms to analyze imagery on a large scale, providing the information in milliseconds. “We have over 60 insurance customers who are using our information for quoting, for underwriting, for renewal and inspection management, as well as some post-catastrophe analysis,” said Kayvan Farzaneh, Cape Analytics chief of marketing, who has been around since the firm’s start.
 “The magic of machine learning and artificial intelligence is that you can start to understand connections that you wouldn’t be able to understand otherwise.”
Kayvan Farzaneh, Cape Analytics
Roof condition is one characteristic most insurers are familiar with, Fazareh said. “We know with high-rigor statistical understanding that a poor or severe condition roof is going to perform much worse in a windstorm, for example, or a hailstorm,” he said. “It’s going to be much more vulnerable to damage.”
That information can be used by the insurer for underwriting eligibility, rating and filing.
“The key thing that we are doing is segmenting and managing risk for the insurance carrier,” Arturo’s Pearson said. “We’re obviously diversifying that risk and we’re also responding to that risk.”
Initially focused on underwriting and claims, Arturo is now getting into pricing.
By accessing the most recent property analytics available, actuaries can identify property characteristics—and changes—that influence price for an individual property or entire portfolio, Arturo’s website reveals. Arturo’s pricing solution provides access to 50-plus property characteristics and also allows carriers to alternatively configure specific property insights to best support their pricing needs.
“Based on imagery we have for Australia or the U.S., we can run the whole country in its entirety within days, not weeks, so that we can give actuarial a view of what’s happening across a country today…or what might have happened in prior years,” Pearson said.
Early Questions, Data Curation Issues
When geospatial imagery was first introduced to property carriers, there were a lot of questions, said Farzaneh at Cape Analytics.
Insurers wanted to know more about the technology, its use, accuracy and value. Carriers wanted to know, “If it’s used in underwriting, is it worth the cost of the data to incorporate into the system?” Other questions centered on how the technology could power better decision-making, underwriting eligibility or pricing decisions, he said.
“We spent the better part of a few years educating the market, because it’s the first time they heard about something like this,” Farzaneh added, noting Cape Analytics has gone from early stage use cases to much broader applications across an organization and an entire book of business for national carriers.
At this point, Farzaneh said insurers see the return on investment. It’s not a question of should we integrate a solution like this; it’s do we go with one company versus another, he said.
By and large, both Farzaneh and Pearson said data curation problems most often occur when an insurer tries to build a system themselves.
“The data wrangling is big and can get super complex,” Farzaneh said, noting it’s a fast-moving industry with new imagery providers entering the market. “Of course, a big part of their business is bringing in data sources and dealing with them,” Farzaneh said, referring to the fact that carriers incorporate other types of data sources into their processes on a regular basis. “We see the geospatial analytics and imagery needs as being a little bit more challenging.”
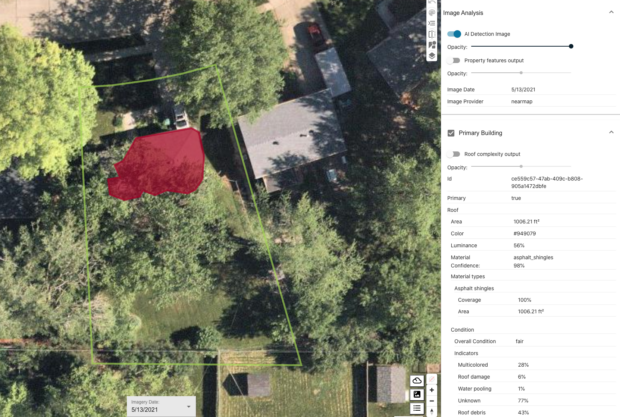
According to Pearson, there are the obvious challenges around rural books of business not typically captured by aerial imagery. “The issue is how do we make it smart enough to understand that, in data curation terms, the whole United States isn’t covered by imagery,” Pearson said. “Yes, it is covered by satellite imagery. But aerial imagery, it ranges from 60-80 percent of the populated areas of the U.S.”
Geocoding is another area where issues can arise. Ensuring the house being viewed is the same address that is being underwritten takes sophisticated technology and infrastructure behind the scenes to make it as accurate as possible, Farzaneh said. But it becomes more complex with commercial property, where there are multiple structures on a single property, or there might be one business that’s part of a multibusiness structure.
Then you layer in traditional property records or hazard information that aren’t part of the imagery analytics but if taken in concert can provide powerful data, Farzaneh said.
“We have a multiple-source approach that allows us to give more actionable information to the underwriter or to the carrier in terms of the risks associated with the property,” he said.
New Risk Signals
As carriers embrace more agile business models, they seek new ways to exploit their own data and merge it with geospatial imaging.
In order to monitor the health of a portfolio and decide whether to accept or reject a risk requires a carrier’s understanding of spatial diversity across a region, Pearson said. Carriers don’t typically spatialize their data, he added.
“If we can bring in some of the information,…then we can start to solve some climate change resilience problems” impacting carriers and insureds, he said, asserting that natural peril is the new norm. That new normal creates an imperative to be more proactive with risk.
Gaining a spatial understanding of risk will allow carriers to better predict hazard outcomes.
“We can see how improvements to what we enforce, in terms of rebuild and replacement, allow us to actually see the improvement in those loss ratios over time,” Pearson said. “So that if we do start to put stronger requirements around having roof materials that are likely to become less damaged and are going to be stronger against hail, then that’s going to benefit the premiums and the policyholder and obviously claims for potential hail events.”
In addition, now that historical imagery is available, carriers can determine if there is a propensity for more swimming pools in one particular state or county, explained Pearson. They can review coverages offered to evaluate whether additional products are necessary.
“These are things that insurers are requesting as they continue to innovate their processes,” said Pearson.
Near-time geospatial data is available from different sensor types that can change a carrier’s responsiveness to risk on the ground. Pearson offered an example of a project with an overseas carrier—the creation of an event control center that pre-estimates risk exposure to natural weather peril, like wildfire, flood inundation, wind and hail damage. An exposure rating on policies in force is provided within 48-72 hours of a major event, he said. The triage process is further supported through connectivity with Arturo’s applications that contain pre-imagery data regarding what happened prior to the event, such as the condition of a roof. This information could prove useful during the estimating or adjusting process.
Cape Analytics also taps into carrier claim databases.
“We have 20 million records spanning the last five or six years. We can go in and analyze properties and look at specific characteristics and at the eventual claims that occur after that image is taken,” said Farzaneh.
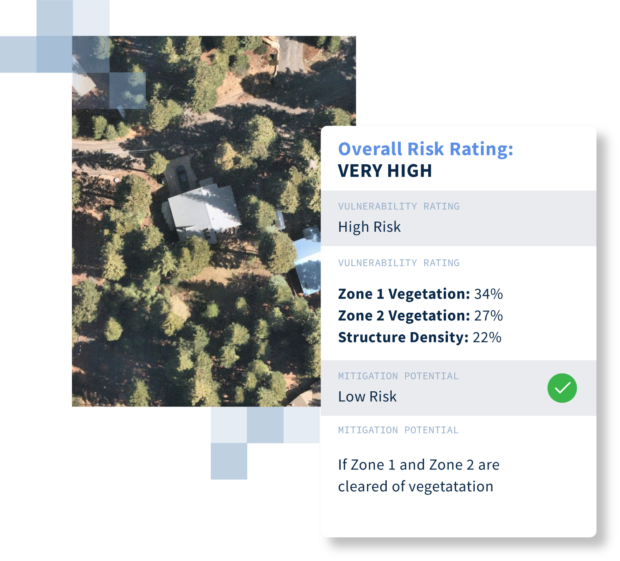
Examining other aspects of a property can assist in predicting the likelihood of a liability claim in the future, he said. Things like the condition or lighting in a parking lot, or vegetation around a home, for example, are among the indicators of potential liability.
It becomes a conversation with carriers to determine if the information is needed and useful, Farzaneh said. And then, Cape Analytics works closely with customers on integration to determine where in the actual coding or underwriting workflow the data is surfaced.
A lot of information is analyzed and ready to go, he added. The analysis portion doesn’t necessarily have to be tasked unless the carrier wants to review something specific in the past. For example, a carrier may want to know, for the 10,000 addresses provided, how the roof condition performed in terms of claims sustained.
According to Pearson, carriers want the option to review their book of business going back five years and see what changed and how it impacts their overall pricing approach.
“We’re typically not building things without quite a bit of conversation with our carriers and with prospects to make sure that there’s some relevance to property risk,” Farzaneh said.
On the Horizon
Besides the quest for better resolution, carriers can expect the refresh rate to improve.
“Rather than every three or four months in an urban area and a couple of times in a rural area, it’s once a month everywhere,” said Farzaneh, forecasting the future.
The industry seeks new data sources to aid in understanding riskier areas within the hazard zones. Pearson sees the growth of near-time weather forensics, whether it’s around tornado, hail, wind or other weather-related events.
The chief strategy officer sees a convergence from carriers that desire everything geospatially available—from weather to three-dimensional views of the environment to digital elevation models depicting where a property is situated.
Arturo is examining ways to facilitate better information related to historical flood records by using advanced technology like synthetic-aperture radar to help with flood inundation mapping. SAR is a form of radar used to create two- and three-dimensional reconstructions, like landscapes.
There will continue to be innovation surrounding the drive to marry resources, Farzaneh said, bringing in even more non-image data resources, creating a superset of analytics for a holistic understanding of the property and how it is evolving over time.
“The more accurate you can get, the closer you can get to understanding risk up front, the more transparent and efficient the entire insurance workflow is going to be,” Farzaneh added.
Carriers are interested in joining the imagery captured during inspections by their adjusters or partner companies with geospatial imagery to provide a holistic view of the interior and exterior of a home, allowing AI firms like Arturo and Cape Analytics the ability to analyze conditions and alert carriers of potential issues.
“At the end of the day, they have to make a decision of what’s coming through from the AI,” said Pearson. “They want to visualize it. They want to understand the risk score associated with it. Or they’ll want to understand potential claims losses.”
There’s definitely a sea change on how property insights can be gained through a geospatial viewpoint, he added.
Farzaneh noted, “The magic of machine learning and artificial intelligence is that you can start to understand connections that you wouldn’t be able to understand otherwise.”
Advances in the use of geospatial imagery show no signs of slowing down.
“We’re still in the early days, and there’s a lot of promise behind the technology,” he said.
Edited by Mike Fitzgerald, CM Guest Editor
Top image provided by Nearmap. Insights by Cape Analytics
 INSTANDA CEO Sees Governance, Human Oversight As Top AI Priorities
 Xceedance Says for Insurers, AI Advantage Is in Orchestration
 New Orleans Port Sues For Tanker Control After Crash Involving Cruise Ship
 Road Deaths Declined to Historic Levels in First Half of 2026