


Hurricane Irma struck the Florida coast on the afternoon of Sunday, Sept. 10, 2017. It moved north through much of the state, unleashing 140-plus mph gusts across the Florida Keys, Lee and Collier counties, and packing hurricane-force winds all the way up to Gainesville before weakening into a tropical storm and then a remnant low. Irma led to 85 deaths, damaged hundreds of thousands of properties and is the fifth-costliest Atlantic hurricane on record.
Executive Summary
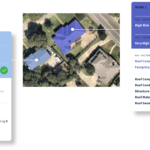
Cape Analytics, a provider of geospatial property intelligence, analyzed the wind-driven roof damage dealt by Hurricane Irma on properties in Florida. Using computer vision to evaluate over one million aerial images of homes for 250,000 properties across four time periods—prior to the hurricane, right after, six months later, and 12 months later—the firm draws insights around the level of damage from a Category 3/4 wind event and how quickly repairs are made. The takeaways:- 25,000 homes suffered major roof-related damage.
- Data suggests 65 percent of repairs occurred between six and 12 months post-event.
- 1,000 homes were still not repaired 12 months after the hurricane.
- Roofs in severe condition prior to the storm suffered 145 percent relative claim frequency compared to excellent roofs.
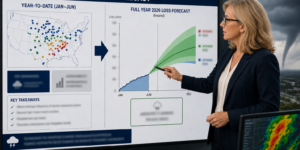
At Cape Analytics, we focus on deriving actionable, easily addressable intelligence from large swaths of imagery. Now that we are two years removed from the storm and have access to several time steps of historical imagery, we’ve run an analysis to better understand the dynamics of this wind-focused event and its effects on property throughout the state.
Utilizing 210,000 address-level residential claims that were provided to us by our collaborative partners, in tandem with our powerful imagery analysis platform, we began analyzing damage across nearly one million data points: hundreds of thousands of properties across multiple time frames from before and after the storm. We also analyzed a random sample of 40,000 homes to understand impact beyond just homes with claims.
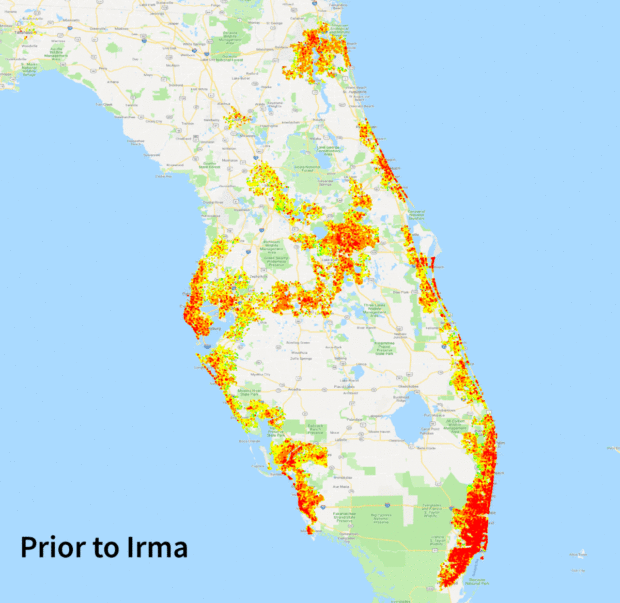
To start, let’s look at the big picture. The visual below shows the general trend of damage as Hurricane Irma passes through Florida. This depicts a larger proportion of red dots, signifying poor or severe roof condition, immediately following the hurricane. Those dots then turn green at the six-month and 12-month marks as properties are repaired. (Yellow dots indicate fair roof condition.)