


It’s been broadly established that imagery-derived data provides benefits to both property insurers and reinsurers, across a variety of use cases.
Executive Summary
Cape Analytics CEO Ryan Kottenstette outlines four criteria property insurance carriers can use to evaluate imagery-based AI technologies based on his discussions with 60 U.S. carriers. He recommends, for example, that carriers verify whether models can be tuned for specific use cases and gives examples to clarify the difference between precision and recall metrics that measure different types of model uncertainty.These use cases touch most aspects of the carrier workflow, from providing more accurate information at the point of quote to streamlining underwriter decision-making and optimizing inspections. More recently, we’ve even seen the first imagery-derived property condition variables being approved and implemented for use in ratemaking.
Even so, as carriers look at the set of available options today, the landscape of imagery and AI technologies can be challenging to parse. Evaluating new AI outputs and connecting them with specific use cases that affect the combined ratio can be daunting. However, after discussions with over 60 U.S. carriers, I’ve identified four base criteria carriers can use to quickly and quantifiably evaluate offerings.
Criteria #1: Verify that data definitions match industry definitions
To start, underwriters, product managers or actuaries should start at the source: variable definitions. It’s important to ask solution providers for clear definitions in order to make sure they map to why and how these variables will be used within the day-to-day carrier workflow.
An algorithm may be 100 percent accurate, but if it does not map to how insurers define and use that variable, it won’t be effective in practice.
Criteria #2: Verify the data’s predictive power and impact on loss
Once the carrier agrees with data definitions, the next step is to verify predictiveness. This can be accomplished via internal studies that determine whether there is a correlation between data and historical results. Doing so requires a look back in time to view data at the start of the policy, then tracking the frequency and severity of eventual claims.
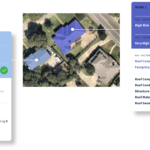
At Cape, we did exactly this for our Roof Condition Rating variable, by comparing our output to over two million customer-provided exposure records. We ended up finding a close relationship between roof condition and the probability of a claim occurring, with roofs judged by the model to be poor and severe with over twice the claims frequency as those judged excellent. The ability to link such data outputs with loss is a key component for using a variable in ratemaking.
In order to satisfy these criteria, any provider must have access to a statistically significant number of claim records from the last few years, as well as the historical imagery at, or shortly before, policy start dates. Then they need to run their models on historical imagery and apply the appropriate actuarial analysis.
A carrier interested in using imagery-derived information for rating should consider re-running this analysis with the provider, using their own exposure and claims information across tens of thousands of locations, to verify loss impact for their portfolio.
Criteria #3: Verify that data outputs can be tuned for specific use cases
There is a myth that I have seen repeated within the industry around the existence of perfectly accurate data. For example, I have seen a number of insurers make the mistake of assuming inspectors are always correct. However, people—like machines—can get things wrong. We have seen many instances in which different inspectors interpret guidelines differently or only get a cursory look at a property.
This is where the superpower of AI becomes evident. AI’s ability to operate at a massive scale makes it possible, for the first time, to measure and define exactly where uncertainty occurs within an algorithm’s data output. By identifying this uncertainty and tuning the output, AI can compete with a collection of humans evaluating the same set of criteria. In tech parlance, we define this uncertainty in two ways: precision and recall.
To understand precision and recall, consider an AI model that seeks to identify properties with gabled roofs. Let’s say it analyzes images of 100 roofs and labels 40 as gabled. However, only 30 of those 40 are actually gabled. In this case, the model’s precision is 75 percent (30/40 x 100). In other words, 10 results are false positives. Data tuned for precision aims to minimize false positives.
Let’s also assume that out of all 100 roofs analyzed, there were 50 gabled roofs in reality. Since the model only identified 30 of the 50, it missed 20 of the roofs that were actually gabled—falsely identifying them as hip or mixed-type roofs. Recall is the percentage of all positive results that are correctly identified by the model—in this case, 60 percent (30/50 x 100). Twenty results are false negatives. Data tuned for recall aims to minimize false negatives.
The ability to post-process adjust an AI-derived dataset for precision or recall can have a large impact on usefulness for insurers. A couple of examples demonstrate the importance of this capability:
In a highly competitive quoting environment, a carrier may emphasize quickly quoting good business at a competitive price. In this case, they want to “see a lot of pitches” and to make sure that when they decide to provide a quote, it’s only on low-risk policies. This calls for high precision in detecting good risks—it’s more acceptable to lose a few good risks in the pipeline than to quote insufficient rate for much riskier business.
On the other hand, a carrier that has a more proprietary but limited channel for new business will want to see all the business that must be good or might be good, without accidentally turning away any good risks. This would call for high recall of good risks.
A few telltale signs indicate whether a vendor can tune its data output for specific use cases. First, the vendor should be offering confidence scores for key variables and labels. Second, they should be offering to advise the carrier on how to adjust confidence thresholds for maximum impact.
Criteria #4: Verify the provider is enterprise-ready
These capabilities broadly fall under the umbrella of “enterprise readiness.”
First off, in order to be effective, a provider should be able to work at scale. If the provider cannot test confidence scores and loss impact at scale, across millions of locations and time periods, then it’s challenging to parse data output quality. This requires infrastructure capable of running such tests quickly, without waiting weeks for a satisfactory answer.
Carriers can verify these capabilities by asking for a sample hit rate on a minimum of 50,000 locations, distributed across a portfolio, and seeing how quickly that information is returned. The insurer may also want to ask about processing architecture, information security hygiene and data redundancy infrastructure.
In the end, there are many criteria against which a carrier can grade an imagery analytics provider. However, I believe these four pillars provide strong initial guidance into how a carrier can approach an evaluation. In fact, testing definitions and predictiveness are staples of any decent data source—whether they are derived from AI algorithms or not. Taking a more rigorous approach in understanding how new forms of data are generated and the workflows they are best suited to impact will help the buyer choose the best solution for their business.
 IBHS Wildfire Prepared Program Expands to 10 More States
  Owner, Operator of Ship That Crashed Into Baltimore’s Key Bridge Settles With State for $350M
  Deep or Shallow? Previewing the 2026 Soft Market