


More than 50 percent of insurers use growth as a key metric to set executive compensation, according to a recent report.
The report by Standard & Poor’s Rating Services summarized findings of an enterprise risk management survey across all segments of the insurance industry—including property/casualty and life insurers and reinsurers—which delved into questions about carrier preparedness to meet regulatory mandates on risk management disclosure and carriers’ measures of risk tolerance in addition to executive compensation metrics.
During a recent interview at the 2014 PCI Annual Conference in Scottsdale, Ariz., S&P Director Sridhar Manyem discussed with Carrier Management the implications of the findings on executive compensation.
Compensation is “a key risk cultural driver of behavior,” he said. “If you’re going to incent them based on the amount of risk that they are taking, they are going to underwrite risk.”
Manyem recalled the troubles that sprang up at Countrywide Mortgage during the 2008 financial crisis. “While there was a lot of good talk about risk controls, the underlying incentive metric was for the underwriters to go and write as much premium as they had to. They were going to go and write risky mortgages because the amount of compensation they got was the amount of underwriting premium that they generated, regardless of risks.”
The S&P report set forth some similar concerns surrounding the finding that growth is the most used compensation metric. Achieving growth “can easily entail additional risks to an organization if that growth is obtained imprudently. It isn’t difficult, in our view, to see how using growth as an incentive for pay might lead some managers to reckless decision-making,” the report said.
Still, Manyem said that while S&P had some initial concern about the high level of attention given to growth at insurance companies, closer scrutiny of the survey results mitigated those a bit. “Peeling back the onion, we realized that many insurance companies don’t just have one metric to evaluate the performance of their executives or underwriters. They have growth, but then balancing that metric is going to be things like combined ratio or return on equity.
“On top of that, these days it is very common, at least for most publicly held companies, to have long vesting periods, where it’s not a matter of luck whether the wind blew the sea or not.”
Instead, “it’s more prudent risk‑taking over a longer term that will determine the compensation structure,” he said.
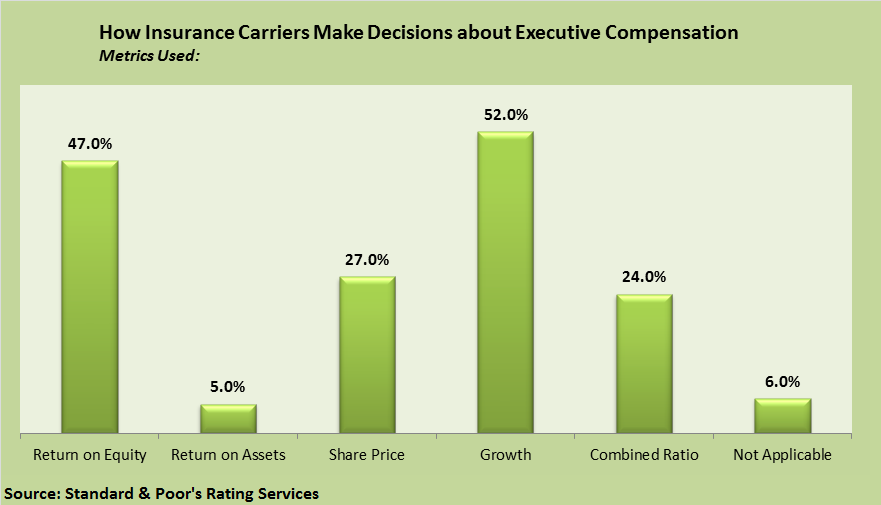
Manyem noted that combined ratio definitely garnered a higher percentage among P/C companies, with overall industry findings summarized in the graph above.
According to the S&P report, published in late September in advance of the PCI conference, 35 percent of survey respondents were life insurers, 22 percent were P/C carriers, another 22 percent were health insurers, and the rest were reinsurers and multiline insurers.
Because compensation is a very key driver of risk-taking behavior, S&P’s risk culture evaluation has compensation metrics as one of the components, Manyem said.
Risk culture is considered in S&P’s enterprise risk management score; risk tolerance and management culture are considered in S&P’s management and governance evaluation. The ERM score and management and governance scores are both used to modify an initial “anchor” rating in S&P’s rating process. (The anchor rating is determined from a business risk profile and a financial risk profile, with factors that look at industry risk, country risk, capital, earnings and financial flexibility.)
“To a large extent, those scores are going to be consistent with each other,” Manyem said, referring to the ERM and the management and governance scores.
“To the extent we feel that, for example, the board is not completely independent and has taken decisions that might have favored executives over policyholders, we have deemed some of the management and governance systems not to have a stronger set of scores.
“In fact, that would be consistent with the ERM scores as well. It’s going to be very difficult for a management and governance score to be weak with an ERM score of strong, because one of the aspects of risk management is the people that drive the processes and the systems,” he said.
Overall, S&P has found ERM processes for the majority of insurers to be adequate, Manyem reported. ERM scores are categorized in five buckets: weak, adequate, adequate with strong risk controls, strong and very strong. Across the S&P rating universe, the breakdown of the ERM scores is: 2 percent are weak; 67 percent are adequate; 12 percent are adequate with strong risk controls; 17 percent are strong; 2 percent are very strong.
“We saw some scores that were weak during times of financial crisis. But I think most of the P/C insurers and reinsurance companies, in general, have been pretty conservative in their enterprise risk management philosophies.”
Manyem said that no P/C companies are in the weak category in terms of managing their risks to stated tolerances.
For more information about S&P’s recent ERM report, which also sets forth findings about the relationships between insurer ERM scores from S&P and their level of preparedness to submit Own Risk And Solvency Assessments (ORSA reports) to regulators, see related article, “Survey Says: For Many, ERM Is a Capital Idea,” written by Manyem for S&P.
For more on S&P’s management and governance scores, see related article, “S&P Explains Rating Evaluation Of Insurer Governance, Management Strategy.
 AI Pushes Underwriting Beyond Risk Selection to Prevention
  Ranking: Who Are the Insurance Industry’s AI Talent, Maturity Leaders?
  U.S. P/C Industry Books Best Result in a Decade, but Not All Lines Enjoy Success
  Four Insurers Join Ward’s Annual Top 50 P/C Ranking for 2026