


A carrier CEO who logs onto RiskMatch—the new platform created by Kabir Syed to enhance the relationships of carriers and brokers—is greeted by a screen with a big number in the upper right-hand corner, something in the billions of dollars.
Executive Summary
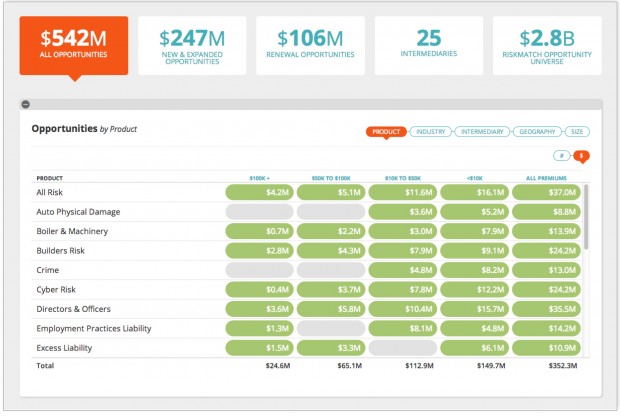
As they sift through opportunities and make decisions on how to allocate resources using information with the RiskMatch platform, carrier executives can also find out the answer to an all important question they ask about every broker relationship: Where do we rank—not only with the broker overall but within each individual brokerage office?On the sample screenshot below—based on a demo Syed gave to Carrier Management in March—that number was $2.8 billion. By mid-July, it was $5 billion. And it’s now closing in on $10 billion, Syed reports.
What does it represent? It is the aggregate premium dollars for brokers participating on the entire RiskMatch platform, also known as the “RiskMatch opportunity universe.”

The $542 million figure highlighted in the box on the top left is the subset of this universe that matches the carrier’s appetite, as indicated by a patented algorithm built into the system.
For whatever reason—bad experiences with certain clients, an appetite in flux or just inattentive underwriters—the carrier has only requested submissions for $353 million worth of the matched opportunities, winding up with $247 million of new and expanded opportunities to add to its current renewal portfolio of $106 million spread across 25 intermediary partners, Syed explains as he demonstrates some system basics.
With that $542 million square highlighted in bright orange, and the “intermediary” bubble highlighted on the corresponding display, the system shows a breakdown of the total “Opportunities by Intermediary” for various account size bands. With quick clicks of his computer mouse, Syed instantaneously changes the display to show the same opportunities by product (shown in the accompanying graphic), by industry, by geography or by size.
For any of the displays, a user can easily switch from opportunities within a 30-, 60- or 90-day window, he notes. And with another mouse click, the carrier CEO can sort any column of the display—for example, clicking on the right-most “all premiums” column to put the brokers representing the most opportunities on the top (or the least).
Syed then clicks on the name of one intermediary, changing the view completely to show a quick snapshot of the broker—where it is located, the market relationship contact and then a new set of displays showing everything from the current book by product; opportunities by location; submission status; and performance ratios by premium, product, industry, location or size.
Mining Opportunities
But let’s say our impatient CEO asks Syed how he can find more business from these brokers—bent on moving from his $353 million in the pipeline to grab onto some more of that $2.8 billion universe.
That’s built into the “Discover Opportunities” feature, the last stop on an hour-long tour of the platform through which Syed guided Carrier Management.
Clicking first on “Market Opportunity” from a left-hand menu available in the CEO’s custom view, he produces a gray map of the entire United States with beckoning green bubbles positioned over different geographic points. With relative bubble sizes indicating relative amounts of premium written by all RiskMatch brokers for the location, Syed hovers over the Alabama bubble, generating a popup showing the premium pool for the state and the number of RiskMatch brokers writing there.
Now highlighting a box labeled “Discover Opportunities” on a top menu, Syed demonstrates how an executive or a product manager can find out more about business available to be mined for potential product launches. Clicking through various “discover” menus, he selects three states, four industries, public rather than private companies, a specific size from ranges of employee counts, along with other attributes of potential clients for a new carrier campaign.
“We let you go through this [to] see how many potential clients there are, how much premium there is and how many intermediaries do the business. This is almost like doing market research,” Syed says.
“We won’t give the broker names until you put in the appetite,” he adds. “Otherwise, it’s just like I’m a data provider. I do not want to be a data provider. I want to be in the connectivity business and the analytics business—not just to say, let’s test it out so I don’t have to pay an external market research company.”
Setting an appetite is a similar point-and-click exercise, Syed demonstrates by clicking on industries he wants to include or exclude, acceptable TIV ranges, specifications about catastrophe exposure (keeping it less than a certain percentage), even allowing him to exclude potential clients in specific counties of certain states and to upload a URL with marketing material to the system.
When a carrier product manager saves a new appetite, the system stores the new information and also returns a list of other individuals in the company with overlapping appetites, Syed reveals.
Where Do We Rank?
What else do CEOs really care about? They want to know how they stack up against the competition. More precisely, they want to know: “Where does my company rank in broker’s office?”
Syed displays screens titled “Relative Rank and Position” to provide the answer.
With brokers listed down the left-hand column of the on-screen chart, the next column shows the number of carriers that each broker deals with—27 for Broker 1 in the prototype screenshot, 21 for Broker 2, 15 for Broker 3.
Numbers displayed in the next eight columns—the first marked “overall” and the others labeled for various lines of business (property, casualty, executive risk, etc.)—show the carrier’s ranking with each broker for each line, and for all lines, based on premium.
The number 3 under property for Broker 1 is displayed in green; the number 17 under workers comp in red. Translation, this carrier ranks in the top 25 percent of all carriers dealing with Broker 1 for property but in the bottom 25 percent for workers comp.
Syed clicks through the system producing similar charts, revealing how the carrier is ranked within different offices of the broker as well. Other screens list unnamed competitors to the CEO—as Carrier A, B, C, etc.—indicating which of the competitors won the business that his or her company lost in various lines and industries.
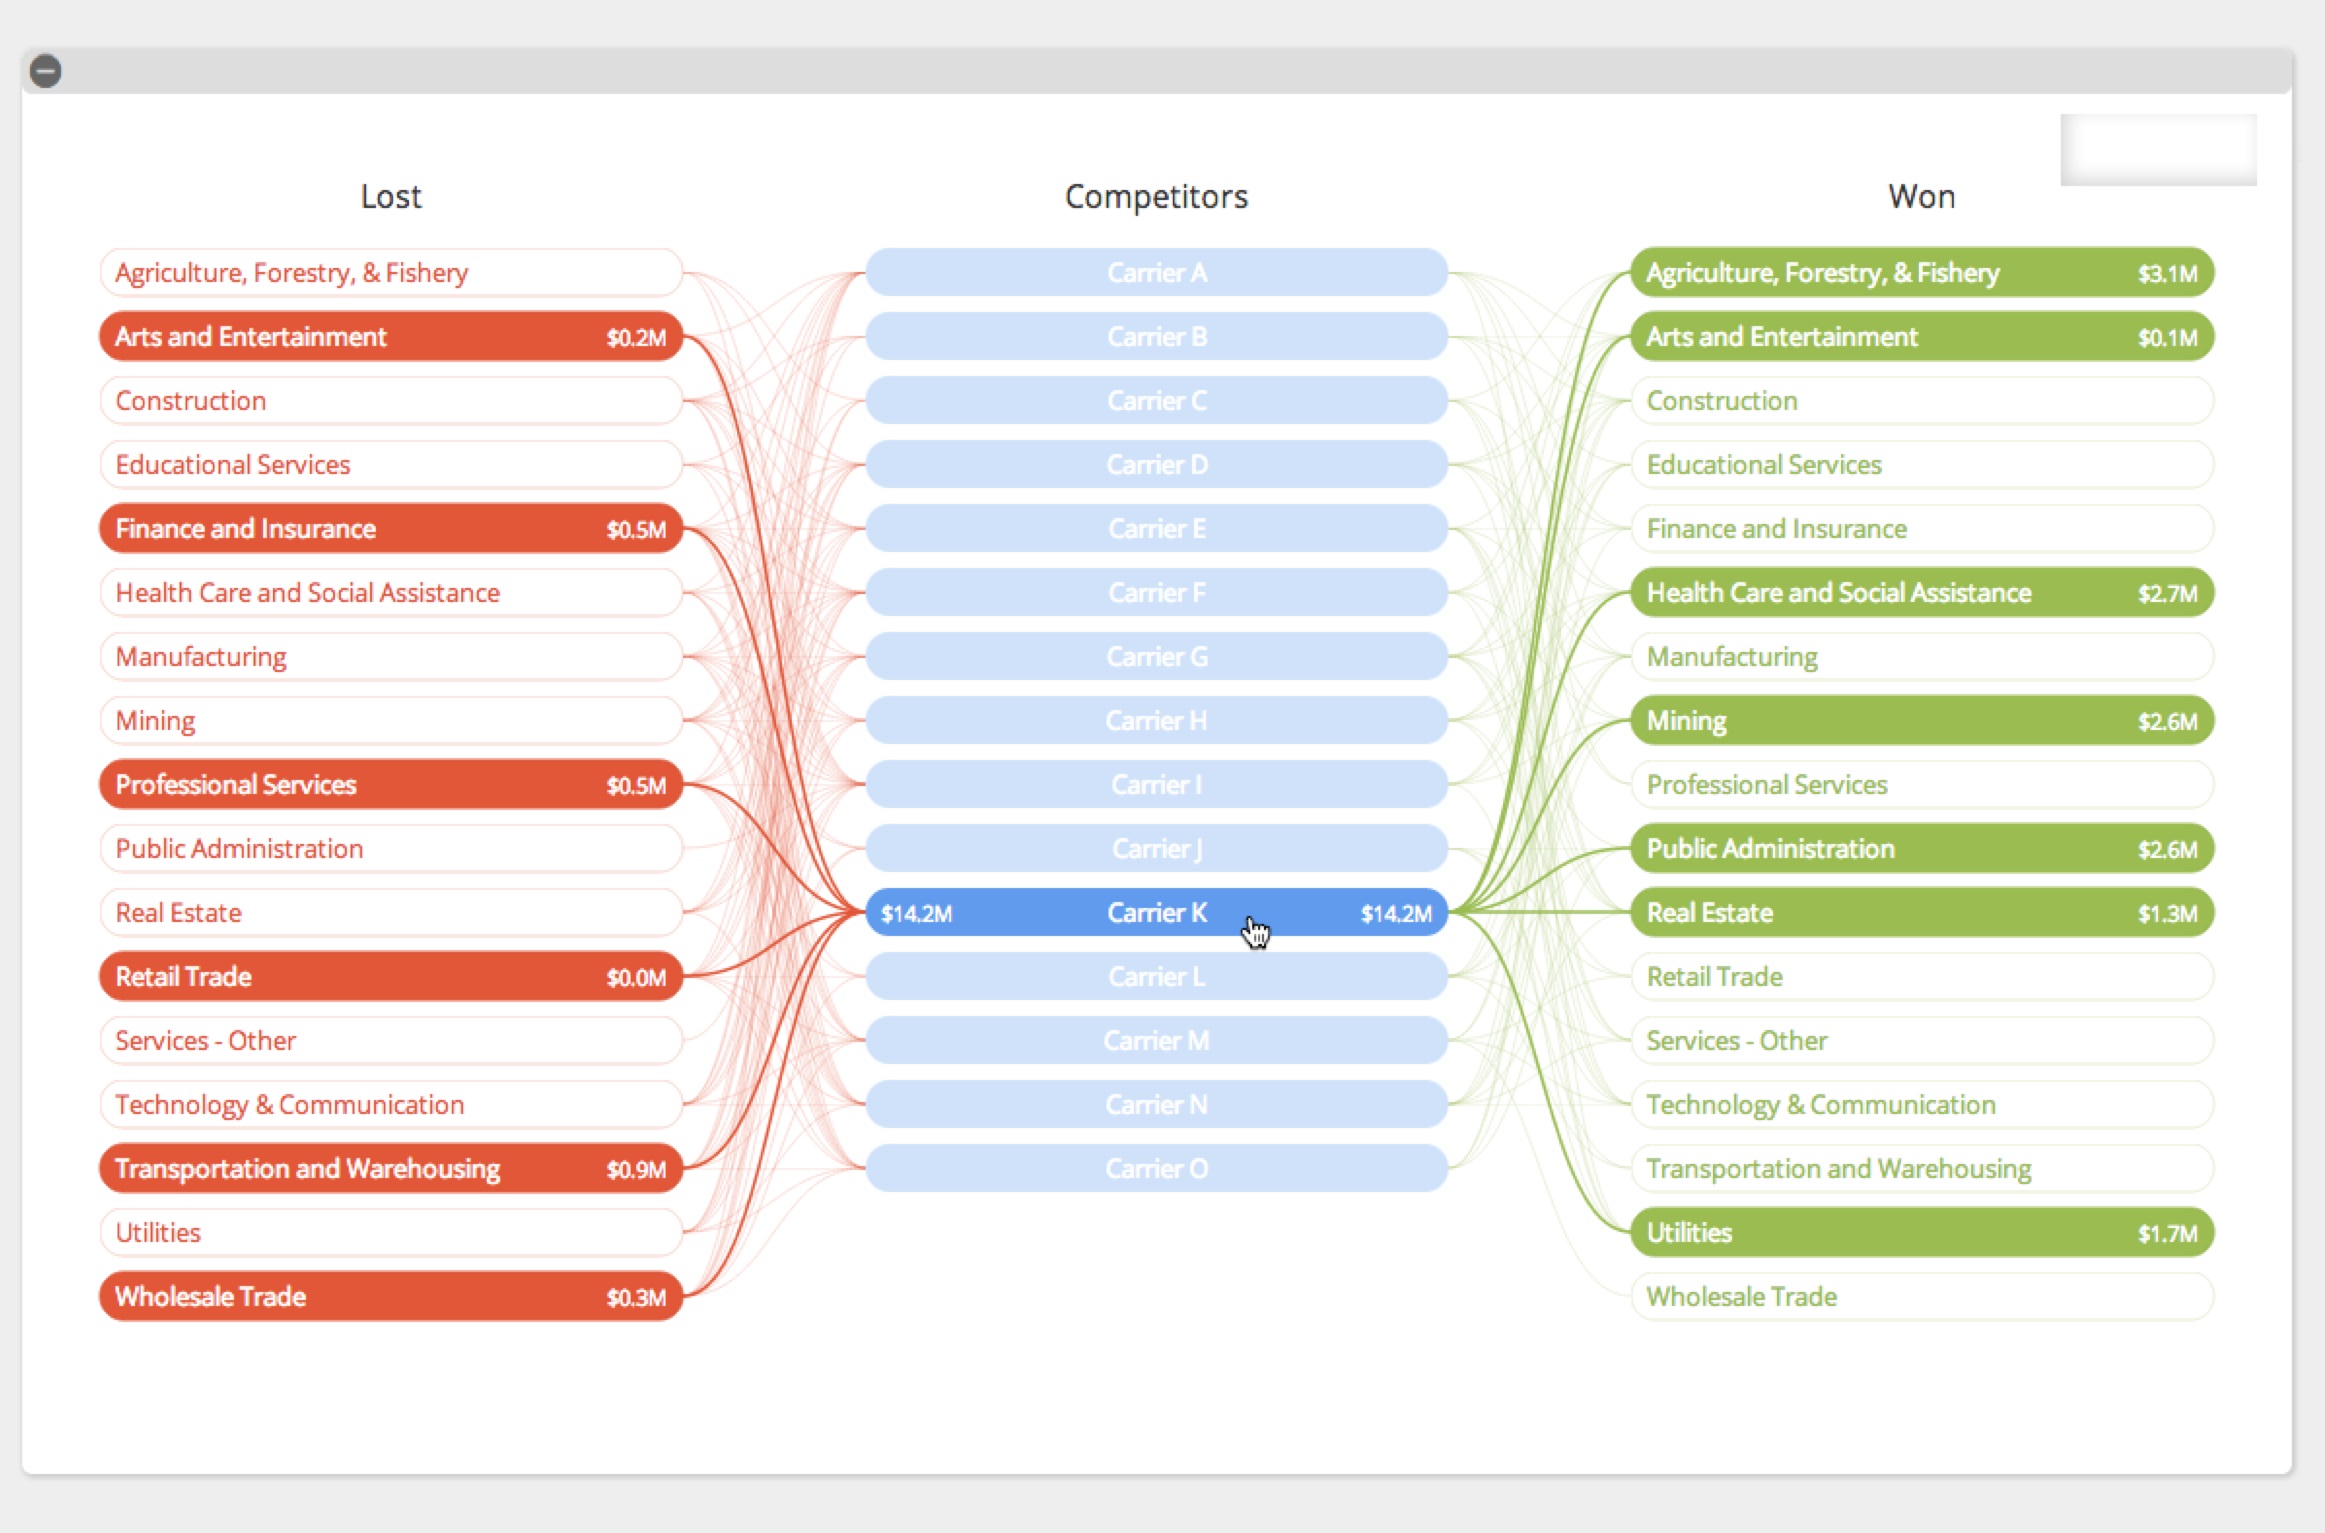
Adam Kagan, RiskMatch’s chief marketing officer, gives some perspective on the need for competitor analysis. “Let’s say you’re in a competitive environment and there are 18 different markets competing. Well, how are you going to grow when there are 17 other competitors?
“It’s going to be more modest than if there are seven carriers in the space. Your expectations in the space may be greater in growth because you’re not competing against so many different carriers.”
This helps carriers make decisions about resource allocation—to see if investing more money can potentially make a difference in their footprints.
The other way RiskMatch assists with decisions about resource allocation, or simply knowing where carriers have relationship problems that need to be fixed, is with views of performance ratios—hit ratios, declination ratios, lost businesses ratios—measured against their best and worst performing competitors.
Does RiskMatch Have Competitors?
Amid the references to the competitive dynamics of the P/C industry from Syed and Kagan during the demo, we couldn’t help but wonder whether RiskMatch itself is facing competition. Are the Wells Fargos and Locktons of the broker world developing their own systems to rival Marsh’s MarketConnect, Aon’s GRIP, Willis’ WillPLACE and now RiskMatch?
It’s unlikely, Syed believes, pointing to the amount of investment and expertise required as obstacles for the other brokers. “The third reason is the patent,” he says, noting that Marsh now owns the patent on single-broker to multiple-carrier platforms and Syed owns the patent on multiple-broker to multiple-carriers platforms. There is a third patent owner for another online connectivity tool, which was licensed by the Lexis Nexis Exchange to simplify the submission of small and midsize risks by agents and brokers to multiple markets, Syed notes.
From a carrier perspective, “that’s their worst nightmare—for a lot of proprietary systems to come out of the woodwork,” Kagan says, noting that it makes more sense to have RiskMatch handle their relationships with 90-something brokers at once, which is the goal.
 Flood Risk Misconceptions Drive Underinsurance: Chubb
  Winter Storm Fern to Cost $4B to $6.7B in Insured Losses: KCC, Verisk
  Retired NASCAR Driver Greg Biffle Wasn’t Piloting Plane Before Deadly Crash
  Modern Underwriting Technology: Decisive Steps to Successful Implementation