


Hurricane Irma struck the Florida coast on the afternoon of Sunday, Sept. 10, 2017. It moved north through much of the state, unleashing 140-plus mph gusts across the Florida Keys, Lee and Collier counties, and packing hurricane-force winds all the way up to Gainesville before weakening into a tropical storm and then a remnant low. Irma led to 85 deaths, damaged hundreds of thousands of properties and is the fifth-costliest Atlantic hurricane on record.
Executive Summary
Cape Analytics, a provider of geospatial property intelligence, analyzed the wind-driven roof damage dealt by Hurricane Irma on properties in Florida. Using computer vision to evaluate over one million aerial images of homes for 250,000 properties across four time periods—prior to the hurricane, right after, six months later, and 12 months later—the firm draws insights around the level of damage from a Category 3/4 wind event and how quickly repairs are made.The takeaways:
- 25,000 homes suffered major roof-related damage.
- Data suggests 65 percent of repairs occurred between six and 12 months post-event.
- 1,000 homes were still not repaired 12 months after the hurricane.
- Roofs in severe condition prior to the storm suffered 145 percent relative claim frequency compared to excellent roofs.
At Cape Analytics, we focus on deriving actionable, easily addressable intelligence from large swaths of imagery. Now that we are two years removed from the storm and have access to several time steps of historical imagery, we’ve run an analysis to better understand the dynamics of this wind-focused event and its effects on property throughout the state.
Utilizing 210,000 address-level residential claims that were provided to us by our collaborative partners, in tandem with our powerful imagery analysis platform, we began analyzing damage across nearly one million data points: hundreds of thousands of properties across multiple time frames from before and after the storm. We also analyzed a random sample of 40,000 homes to understand impact beyond just homes with claims.
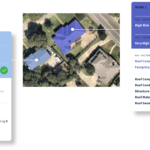
To start, let’s look at the big picture. The visual below shows the general trend of damage as Hurricane Irma passes through Florida. This depicts a larger proportion of red dots, signifying poor or severe roof condition, immediately following the hurricane. Those dots then turn green at the six-month and 12-month marks as properties are repaired. (Yellow dots indicate fair roof condition.)
As we dove deeper into the 210,000 claims across Florida, our imagery-analyzing AI found roughly 11.8 percent of claims, or 24,650 homes, suffered major roof-related damage (enough to register one or more step-changes downward in Cape’s 5-point Roof Condition Rating score). Within the homes that saw major damage, we found a notably large spike in homes registering severe roof condition after the hurricane. The percentage of severe roofs increased from 3.8 percent to 10.2 percent—a 268 percent increase—in the analyzed sample of properties.
Analysis across multiple time steps found that 95.7 percent of homes with major roof-related damage, or 23,600 homes, were fully repaired within a year. Another 1,050 homes (4.3 percent) were still severely damaged at the 12-month mark. In addition, we found that most severely damaged roofs took between six and 12 months to be repaired, indicating a significant lag time between claims and repair. In looking at hard-hit areas such as Lee and Collier counties, we estimate 30 percent of repairs to homes with major roof damage were completed within six months, while 65 percent of repairs took between six and 12 months, and nearly 5 percent (over 1,000 policies) took over 12 months to repair or were not repaired at all.
In the below visual, focused on Naples (in Collier County) and Ft. Myers (in Lee), the distribution of damage from Irma can be clearly seen—as can the repairs, which mostly take place between six and 12 months after the event.
But what about claims frequency? Did the roof condition rating of a property prior to the hurricane have an effect on the probability of that property suffering a claim? We looked at the 34,400 claims within Lee and Collier counties, which saw the highest combination of wind exposure and population density, to run our analysis.
Here is what we found:
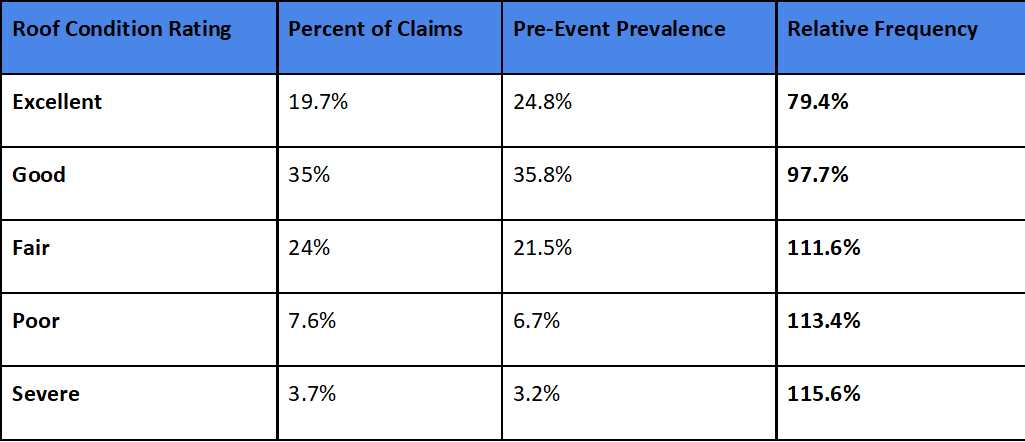
Note: Another 10 percent of the roofs are “unknown” and unable to be classified by the AI, typically because dark shadows or trees cover a large proportion of the roof.
The findings are clear and should come as no surprise: Excellent and good roofs have a lower than average claim frequency, while fair, poor and severe roofs have higher than average frequency. When comparing the best and worst roofs, we find severe condition roofs to have 45 percent higher claims frequency than roofs in excellent condition. There is a clear signal here that properties with fair, poor and severe condition roofs have a higher likelihood of filing a claim.
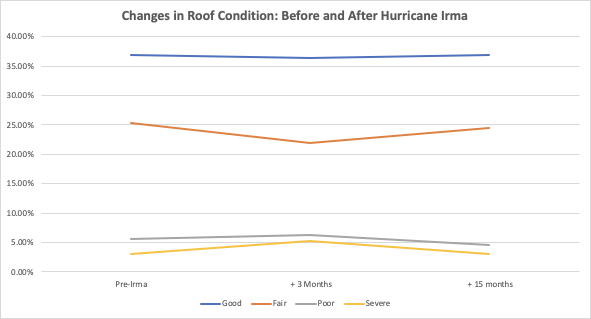
Lastly, we wanted to gain an understanding of how the hurricane affected the overall housing stock in impacted areas—not just the homes that reported a claim. To do this, we took a sample of 40,000 random residential properties, again focusing on Lee and Collier counties.
In looking at these properties, we found that average Roof Condition Rating dropped appreciably post-event and took 15 months to return to the same point, indicating that overall risk exposure normalized within that time frame. We found that Irma resulted in a 31 percent increase in homes with poor and severe roof condition across these heavily impacted areas. In the below visual, it’s easy to see the dip in good and fair quality roofs and the increase in poor and severe roofs after the hurricane.
Overall, our analysis produced some very intriguing results around roof-related damage sustained from Hurricane Irma, the effect of pre-event condition on damage frequency, and identifying the time gap between claim and property repair. Carriers and reinsurers can use such insights to inform their risk selection and measure their overall wind exposure with a higher-fidelity understanding for how roof condition affects potential loss.
Such studies are only possible due to new data sources like aerial imagery and the creation of accurate, scalable AI platforms. As such capabilities increase, it may soon be possible to unlock new insights and answer more detailed questions across time, geography and other forms of data. Here are a few questions that could be considered in the future:
- How do different carriers compare in terms of post-event repair speed?
- How are specific geographies or regions recovering after a CAT event?
- How are different socioeconomic populations being disproportionately affected by the same event?
Answering these and other questions will allow carriers and reinsurers to better manage their risk exposure and event response when encountering future storms.
 Why Consistency Beats Creativity in Insurance Marketing
  Executives on the Move at SiriusPoint, Canopius Group, Badger Mutual
  Let’s Talk About Insurance Distribution Before ChatGPT Disrupts It
  Raised on Breaches, Digital Natives Think Differently About Cyber Risk