


Four hours after Hurricane Andrew made landfall near Homestead, Fla. in 1992, catastrophe modeler AIR issued a statement that the insured losses could exceed $13 billion in Florida. Actual losses equaled $15 billion.
Executive Summary
Traditional catastrophe models lack the precision needed to accurately help insurers estimate losses and prepare for the influx of post-disaster claims, says catastrophe risk expert Karen Clark. Instead, she advocates the use of newer open loss modeling platforms, which empower insurers with advanced scientific processes for estimating claims and losses for live events in real time.Five days after Hurricane Irma made landfall near Cudjoe Key, Fla., AIR estimated the losses in the U.S. would be $25-$35 billion (revised from an earlier range of $20-$40 billion). PCS has recently pegged the U.S. loss much lower (exact figure available directly from PCS), and as of this writing in early October, the Florida insurance department has tallied just $4.6 billion in estimated insured losses.
Hurricanes Harvey and Irma clearly demonstrated that 25 years of cat modeling and numerous model updates have not improved the accuracy of traditional hurricane models. Recent events indicate a trend in the opposite direction with wider ranges and less precision in the loss estimates.
Newer open loss modeling platforms are reversing this trend and providing more accurate information to insurers before, during and after actual catastrophe events.
Modeled Loss Estimates for Harvey and Irma
Insurers and reinsurers become hungry for information as soon as a hurricane threatens to make landfall. CEOs, boards and investors want to know what their company losses are going to be, and claims professionals must prepare for handling tens of thousands of claims. Historically, catastrophe models have not provided a lot of data to support these important questions and processes.
Typically, the traditional model vendors issue a wide range of loss estimates days after the event. This information is not timely or accurate enough to be useful to decision-makers.
Newer models empower insurers with advanced scientific processes for estimating claims and losses for live hurricanes in real time. For example, beginning days before landfall, the National Hurricane Center’s (NHC) projected track files can be ingested by the RiskInsight open loss modeling platform to generate high-resolution wind, storm surge and inland flood footprints. (Editor’s Note: RiskInsight is an open loss catastrophe modeling platform developed by the author’s company.) These footprints are then superimposed on insurer detailed exposure data, and thousands of damage functions by construction, occupancy and other property characteristics are used to estimate the number of claims, average claim severity and losses by geography, as shown in the schematic below.
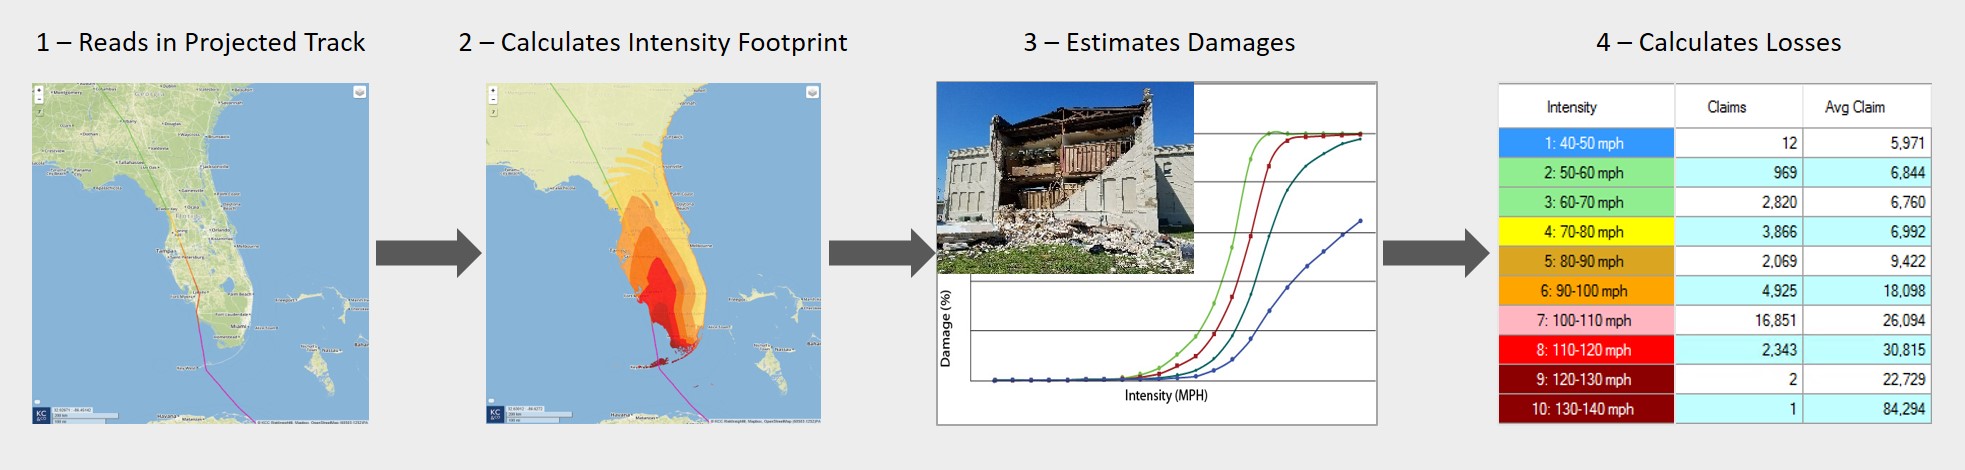
The track files can be updated multiple times a day with new information from the NHC. This information is very important for planning claims handling activities. Insurers need to know where to position adjusters and where the most expensive claims are likely to be. After landfall, insurers and reinsurers continue to get reliable estimates of their company-specific losses.
During live events, the traditional model vendors typically point insurers and reinsurers to pre-generated events that are “similar” to the actual event. After the live event has unfolded, industry loss estimates are released by the modeling firms.
The graph below shows the timeline of the industry loss estimates and how the modeled losses compare to each other for Harvey and Irma.
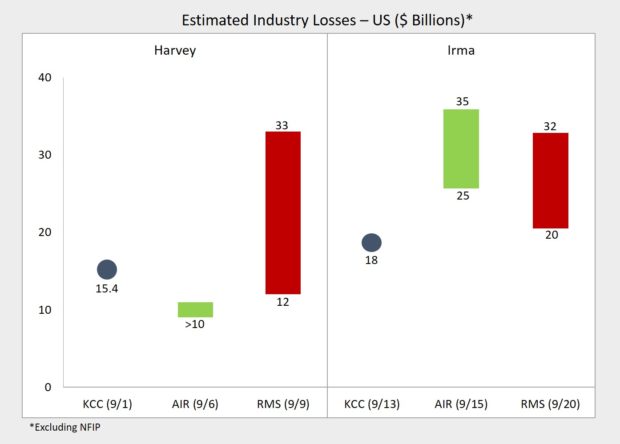
The newer models provide one number versus a range and so far have been more accurate (closer to actual) than the traditional models. By using advanced scientific formulas to develop high-resolution intensity footprints, advanced open loss modeling platforms can accurately estimate the losses for actual hurricanes, thereby supporting real-time decision-making.
The actual losses resulting from Hurricane Maria are still unknown as of this writing in early October, but the range between the modeling firms is even wider. AIR estimates $40-$85 billion; KCC estimates $30 billion; and RMS estimates $15-$30 billion. All modeling firms agree that the losses are dominated by damage in Puerto Rico, but the low and high end of the range differ by more than a factor of five!
Why Accurate, Real-Time Event Losses Are Important
Getting a handle on the size of the loss and the number of claims is very important for the claims function. But even more important, actual events provide the only true tests of the veracity of the catastrophe models and the credibility of the model output—the information used by insurers before the events.
The primary output of catastrophe models is the Exceedance Probability (EP) curve. From this curve, the most important risk metrics, including Probable Maximum Losses (PMLs) and Average Annual Losses (AALs), are derived and used for pricing, underwriting and reinsurance decision-making. The EP curve is generated using a sample of hypothetical future events and is illustrated below.
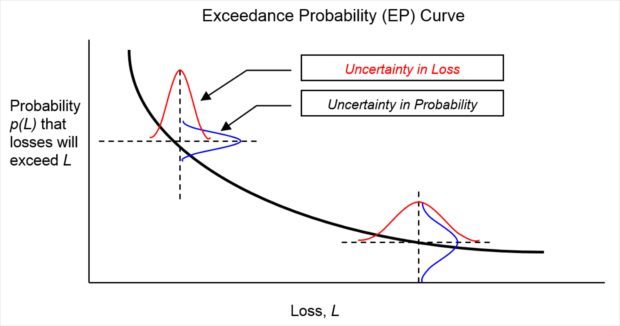
The EP curve shows the estimated probabilities (vertical axis) of exceeding losses of different sizes (horizontal axis). While a specific curve is generated by a specific model version, in reality there is significant uncertainty surrounding these numbers due to data limitations and imperfect scientific knowledge.
There is wide uncertainty around the frequencies and severities of future events in specific locations. For example, scientists don’t know the probability of a Category 4 hurricane making landfall in the Northeast because there isn’t such an event in the historical record. Even estimating the probabilities of Category 4 and 5 hurricanes in the Gulf Region requires judgment because the historical data is sparse.
Catastrophe model developers must make many assumptions based on expert opinion rather than scientific facts, which is why the modeled EP curves can differ significantly between model vendors and between model versions from the same vendor. Until we have hundreds of years of data, it’s not possible to test these assumptions for accuracy.
But the second dimension of uncertainty surrounds the loss that will result when a particular event happens. This can and should be tested whenever actual events occur. Given the meteorological parameters of an event, how well does the model reproduce the event loss?
This is the test provided by actual events like Harvey and Irma. If loss estimates are more accurate for real events, then they will be more accurate for the hypothetical events underlying the EP curves.
After an actual event, insurers and reinsurers also want to know where the estimated loss for that event sits on the EP curve. In other words, they want to know what the estimated return period (inverse of the probability) is for that loss amount according to the model. They can then get an idea if that’s consistent with the intensity of the event and their expectations.
Using Detailed Claims Data to Further Improve the Accuracy of the Models
After a major event, insurers obtain a wealth of claims data that can be used to further enhance the accuracy of their catastrophe models.
The models estimate the loss to different types of structures using a comprehensive suite of damage functions that give the mean damage ratios (MDRs) for different intensity levels. Intensity can be wind speed, surge height or water depth for inland flooding.
The MDRs represent the ratio of the cost to repair the damage to the replacement value of the structure. Both the numerator and denominator in this ratio will be specific to individual insurers.
For example, insurers have their own methods for estimating the replacement values of the properties they insure. Even for a single-family home, there can be a 50 percent difference in the replacement value estimate for the same home between two different insurers. Of course, the numerator will differ based on insurer claims handling practices.
Open loss modeling platforms enable insurers to customize the model damage functions to better reflect their own claims experience. This is another way the newer models are enhancing the accuracy of the model loss estimates.
Over the past 25 years, the trend has been to focus on the science underlying the models rather than the accuracy of the model loss estimates. All of the models are based on the same science—for the most part it is in the public domain. The difference between models is how well that science is implemented and packaged for use by insurers.
There is also a growing disparity between the accuracy of the traditional closed models versus the newer open models. When model components are completely transparent and verifiable, insurers can raise their expectations with respect to reliable information on catastrophe losses before, during and after the events.
 Mythos Proportions
  Exclude It, Harness It, Get Greedy: McGavick’s Take on Insurers’ AI Playbook
  USAA Not Done With Dividends: Florida Reforms Prompt $0.5B Payout