


Insurers handle and pay out millions of weather-related claims each year on homes, businesses, and automobiles. The bulk of these claims result from wind and hail damage caused by severe convective storms. The most active months are March through July, but on any given day, severe weather is likely occurring somewhere in the U.S.
Executive Summary
Whether insurers want to map claims from a “Ring of Fire” meteorological event or less damaging daily weather activity, combinations of sophisticated weather forecast models, dynamic models that detect the formation of hail and tornado, and exposure data used for catastrophe models can help insurers and reinsurers estimate claims impact (the number of claims, average severity and total losses). They can also provide information to develop insights about claims drivers for different event intensities. Risk modeling expert Karen Clark explains the process.Advanced weather forecasting and detection technologies are making it possible for insurers to know in advance where there’s likely to be high wind, hail and even tornadoes. Sophisticated modeling technology enables insurers to translate these weather forecasts into estimates of claims and insured losses. The ability to project the numbers and locations of claims helps insurers to proactively plan and manage their claims adjusting activities.
Improving Weather Forecasts
Meteorologists rely on sophisticated models, such as the Global Forecast System (GFS), a numerical weather prediction model that ingests atmospheric data around the world and at multiple layers of the atmosphere using satellites, surface observations and weather balloons. Detailed equations representing the physics of the atmosphere fill in missing data so that every three hours scientists have updated and complete three-dimensional gridded data for forecasting purposes.
Forecast skill decreases with time and scale. It’s more difficult to make an accurate seven-day forecast versus a three-day forecast, and smaller-scale systems, such as convective storms, are more difficult to model than larger-scale weather patterns. Supercomputers have been improving the extended forecasts of localized severe weather potential primarily by enabling higher spatial and temporal resolutions. With higher resolution and upgraded observational data sources such as the GOES-16 satellite, the GFS can now be used for a skillful forecast of the severe convective storm threat a week before the storms occur.
As a severe convective storm unfolds, other dynamical models, such as the Multi-Radar/Multi-Sensor System (MRMS), take advantage of advanced NEXRAD radar networks and satellite data to detect the occurrence of hail, storm rotation necessary for tornado formation and precipitation. The High-Resolution Rapid Refresh (HRRR) model solves the equations of the atmosphere at high enough resolution to capture meso-scale (intermediate) convective systems responsible for the damaging wind gusts from severe thunderstorms. With an update cycle of one hour, HRRR can be used for near-real-time predictions of rapidly evolving meteorological conditions.
Linking Enhanced Weather Models to the Claims Process
Insurers can now efficiently harness these advanced technologies to proactively manage their weather-related claims. New risk modeling technology is enabling insurers to link these weather products directly to their claims processes.
Skilled scientists are able to use the model output from the GFS to provide a weekly outlook indicating where severe weather is likely to occur over the next several days. For example, in mid-May, the meteorological signals pointed to a major severe weather event across the Central Plains, upper Midwest, and into the Northeast and Mid-Atlantic regions.
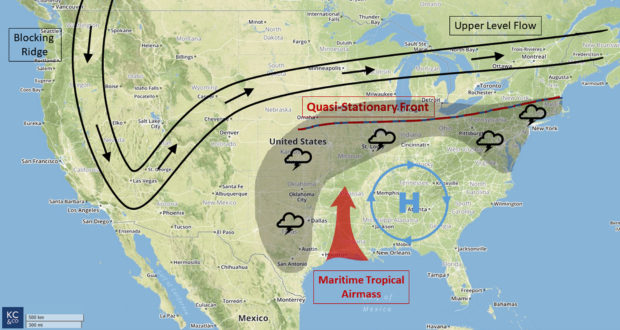
When a ridge of high pressure developed over the West Coast of the U.S. on May 11 and became large enough to block the normal passage of troughs and ridges across the continent, it led to a period of consistent, almost unchanging weather in the Central and Eastern U.S. At the same time, moist air from the Gulf of Mexico flowed into the Southern Plains states for several days, increasing the instability of the atmosphere.
Even though the conditions across the Southeast were unstable, convection was suppressed due to the formation of a center of high pressure. Only around the edges of the high could organized convective be initiated. This classic severe weather setup is referred to by meteorologists as a Ring of Fire.
Scientists were able to predict the increasing potential for convective storm development as the boundary between the maritime tropical air in the Southeast and the dry, continental air to the north and west continued to strengthen. A quasi-stationary front, depicted in the map below, developed at the northern margin of the tropical airmass and triggered convective activity from the Central Plains to the Mid-Atlantic. When the frontal boundary was eventually pushed eastward by a small upper-level disturbance, convergence ahead of the front and the higher upper-level winds created conditions for supercell storms over the Northeast U.S.
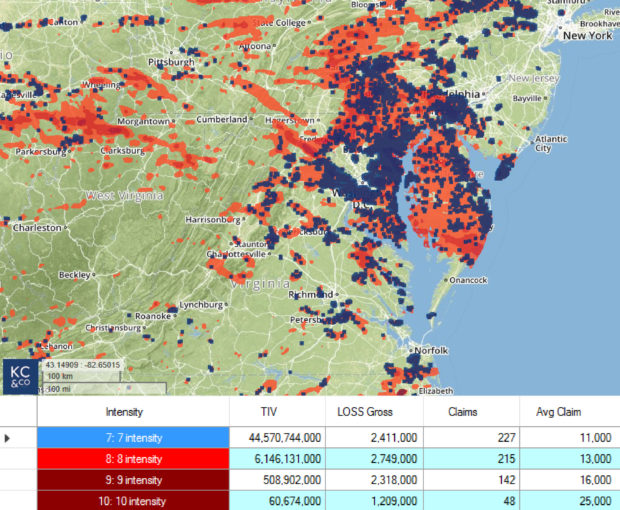
 As this weather system unfolded, high-resolution real-time data from the MRMS and HRRR models were extracted and ingested into advanced risk models to determine where damaging hail and high winds were actually occurring and to create the hail and tornado/wind intensity footprints. The intensity footprints (seen below) show the geographical scope of the event and the likely intensities by location, providing a strong indication of where property damage will be experienced.
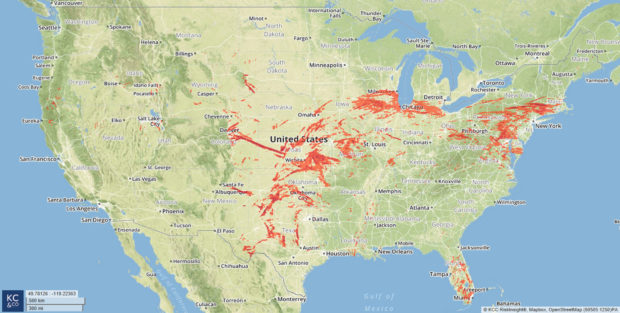
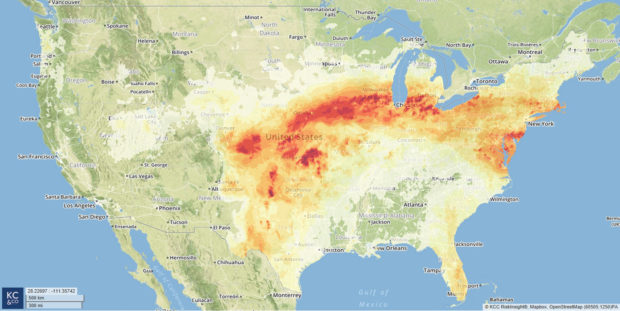 In the hail footprints, darker red areas indicate higher likelihood of large hailstones. Darker reds in the tornado/wind footprints indicate higher frequency of strong wind gusts and increased likelihood of tornadoes. For both hail and high winds, the intensity footprints generally followed the Ring of Fire arc that was predicted days in advance.
The final step to link advanced weather technologies to claims is to utilize the new risk models to superimpose the intensity footprints on the detailed insurer exposure data. This is the same exposure data used in the catastrophe models and includes geocoded locations, replacement values by coverage, and property-specific characteristics such as construction and occupancy. Based on this exposure information and the event intensities, the number of claims, average claim severity and total losses can be estimated.
 For major weather systems, it’s important that the cumulative event footprints are created each day to avoid the double-counting that would occur if each day’s footprint was used independently to estimate the claims and losses.
Not every event is as large and damaging as the May Ring of Fire event, and this process is suitable for all types of meteorological activity. Because weather is always occurring and generating claims across the U.S., insurers have implemented this new technology to monitor daily activity in order to capture all weather-related claims. This process also results in a rich database of claims matched to event intensities that can be mined to uncover new insights into the drivers of losses.
Benefit of Being Proactive
New risk models can now be linked to advanced weather forecasting technologies to provide accurate and timely information on weather claims. Insurers can now know days in advance where there’s likely to be severe weather and resulting claims activity and can accurately estimate claim counts and amounts on a daily basis—from hail, tornadoes and high winds resulting from severe convective storms.
Along with positioning claims adjusters to handle the claims, insurers are proactively reaching out to their policyholders who may experience property damage. In addition to enhancing customer goodwill and satisfaction, these proactive measures help to mitigate the damage.
Another benefit of this new technology is identifying any damage and claims that are likely not based on the most recent weather events so that those claims can be handled appropriately.
 AI Pushes Underwriting Beyond Risk Selection to Prevention
  Leadership Change at Vantage: Former Arch Execs Grandisson, Gansberg to be Chair, CEO
  Beyond the Weather News Bulletins: How Insurers Can Improve NatCat Responses
  The $400,000 Chief of Staff Is the CEO’s Secret Weapon in the AI Age