


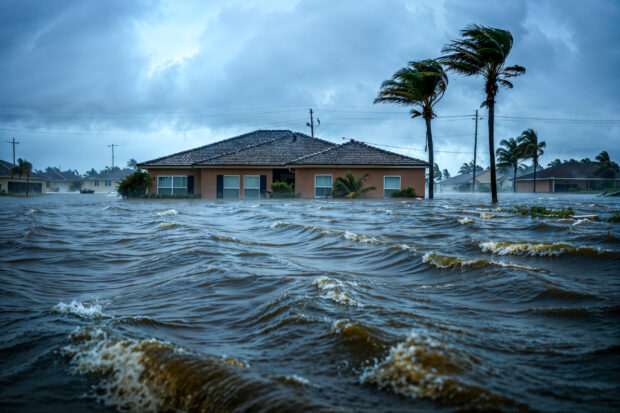
Recent analysis indicates that the National Flood Insurance Program’s current rate structure is insufficient to cover historical and projected losses due to rising construction costs, according to Craig Poulton, chief executive officer of Salt Lake City-based Poulton Associates, LLC.
NFIP RATE INCREASE VS. INFLATION
This graph illustrates five key metrics related to the National Flood Insurance Program (NFIP) rate inadequacy (rates are expressed per $100 of total insured values):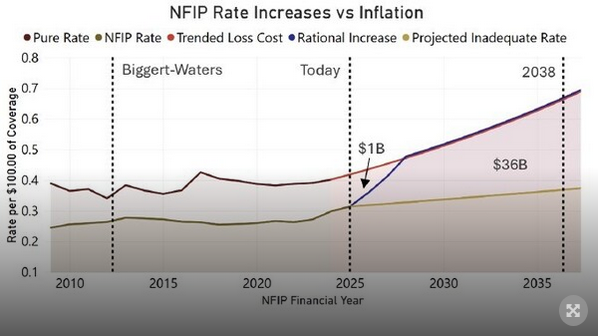
Key Metrics and Definitions
Pure Rate: The rate required to fully fund NFIP claim payments based on historical data.
NFIP Rate: The average rate charged by the NFIP historically.
Trended Loss Cost: The future rate required to capture losses, considering only projected increases in construction costs without any attempt to project weather patterns.
Rational Increase: This is the rate of increase needed to achieve the Trended Loss Cost within three years. It requires a 15 percent annual increase.
Projected Inadequate Rate: An estimate of the future average rate the NFIP will likely charge based on long-term historical trends, assuming no intervention by the Executive Branch or Congress.
Rates are analyzed in relation to historical loss patterns, anticipated future costs, and the program’s financial sustainability, in relation to increasing construction expenses, explained Poulton. The findings and projections presented aim to provide enhanced context and clarity to the dialogue surrounding the continuance of the NFIP.
PURE RATE
The pure rate is derived from Department of Homeland Security Financial Reports (2003-2024), representing the rate required for NFIP to fully cover claim payments. This rate is calculated by dividing the Gross Program Claims Payments by the cumulative total coverage per $100 of total insured values, providing the necessary rate to cover average annual losses.
NFIP RATE
The rate is calculated using FEMA’s NFIP Redacted Policies database (2009-2025). It represents total insurance premiums (excluding fees and surcharges) per $100 of total insured values, measured from October 1st to September 30th annually. 2025 is calculated using the data available as of February 3rd, 2025.
TRENDED LOSS COST
This projection shows future break-even rates based solely on average historical claims payments plus construction cost inflation and makes no adjustment for expected claims acceleration due to climate change. The 16-year average construction cost inflation rate of 4 percent was used (2009-2024 derived from U.S. Census Bureau construction cost data).
PROJECTED INADEQUATE RATE
This estimate shows future NFIP rates based on the NFIP historical trend line, using the average annual increase of 1.15 percent observed by the NFIP Rate from 2012-2025.
Also highlighted by the graph are historical data demonstrating that the NFIP has consistently undercharged policyholders, resulting in significant taxpayer-funded losses of over $38.5 billion, including debt, the analysis showed. Assuming long-term rate increase patterns hold, the NFIP could accumulate an additional $36 billion in debt by 2038.
While the NFIP’s Risk Rating 2.0 aims to align premiums with actual risk by 2033, the Homeowner Flood Insurance Affordability Act of 2014 caps rate increases at what may be unrealistic levels, Poulton said.
“While the NFIP has never undertaken overall rate increases that have come even close to the maximums allowed by Congress, this limitation, combined with rising construction costs and the NFIP’s tendency to favor subsidized rather than predictive rates, is projected to create perpetually widening taxpayer funding of NFIP claims,” he added. “For example, considering only the next 12 years, claims are estimated to reach $96 billion. This is estimated to be covered by $60 billion in premiums and $36 billion in debt from the NFIP. These projections will likely vary depending on weather patterns and the NFIP’s commitment to rate adequacy over time.”
According to the analysis, achieving financial stability within the NFIP requires removing or adjusting legislative caps on rate increases, aligning rates with predictive, risk-based models rather than massively subsidizing flood insurance rates, and implementing sustained, actuarially sound rate increases over a period of far less than the ten-year Risk Rating 2.0 target.
Since the NFIP is already two years into its ten-year “glide path,” an additional three years to achieve rate adequacy will realize a five-year glide path. This 3-year plan in the graphic is called the Rational Increase and requires the NFIP to increase rates by 15 percent on average each year, the Poulton report showed.
“The NFIP’s current rate structure is insufficient to cover historical and projected losses, particularly given rising construction costs,” Poulton said. “While Risk Rating 2.0 aims to address these inadequacies, both historical and legislative constraints suggest that the Risk Rating 2.0 ten-year glide path will extend much farther into the future. To avoid future taxpayer burdens and enhance program sustainability, comprehensive rate reform over a much shorter period of time, such as 3 years, is essential. This publication underscores the necessity for data-driven adjustments in NFIP rates that align with actual financial exposures and economic realities.”
Managing general agent and insurance brokerage Poulton Associates administers the country’s largest private flood insurance program, the Natural Catastrophe Insurance Program.
 Misuse of Driver-Assistance Systems Biggest Risk to Road Safety: Survey
  AI Adoption Continues, But 70% Want More Training: SMB Survey
  AI Pushes Underwriting Beyond Risk Selection to Prevention
  Reframing Like a Fox: How Insurance Leaders Can Catch Strategic Drift Before It Compounds