


Moody’s RMS estimates $4-6 billion in economic losses from the recent Lahaina Conflagration and Kula wildfires in Hawaii, the catastrophe risk modeler said yesterday, estimating insured losses at roughly 75 percent of economic losses.
Separately, rating agency AM Best reported that the small, concentrated area of the disaster puts smaller, concentrated at the most risk of capital impact.
Moody’s RMS estimates the burn footprints in Lahaina and Kula wildfires include insured property value in the range of $2.5 billion to 4 billion.
The estimate is similar to an earlier flash estimate from Karen Clark & Company, which put the insured property losses at around $3.2 billion.
Moody’s RMS said that most of the economic damage is expected to be covered by insurance, in the range of approximately 75 percent. Wildfire is a covered peril under typical insurance policies and the island has high insurance penetration rates, the modeler said.
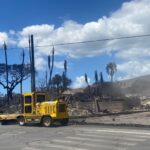
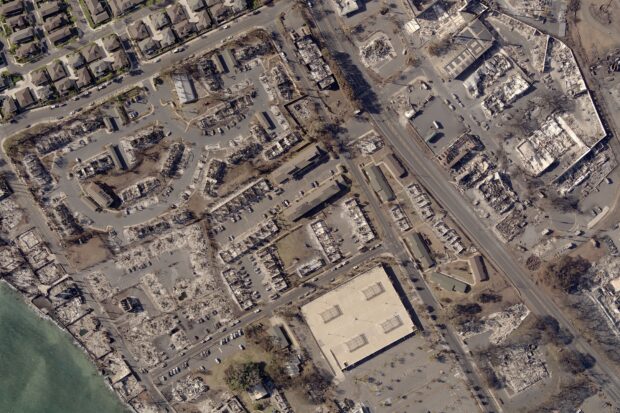
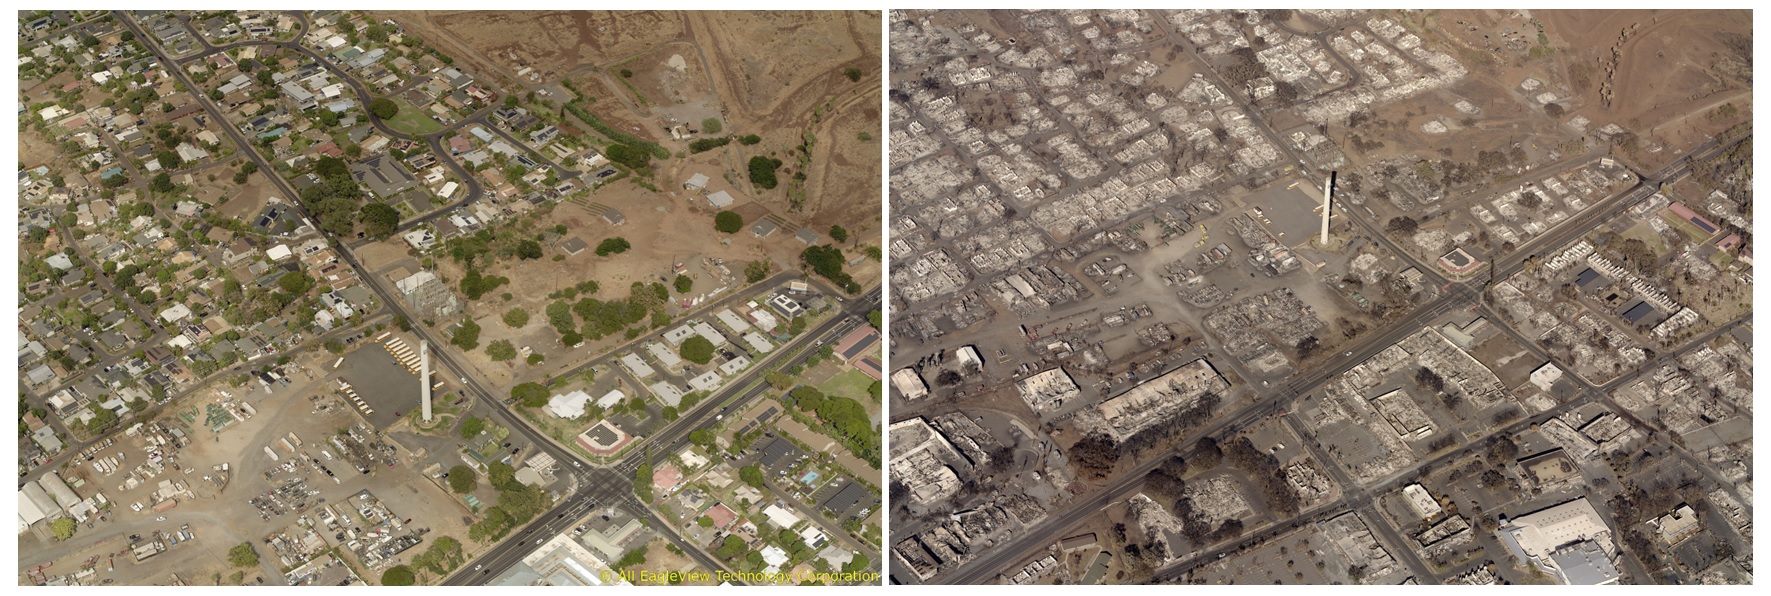
Most of the event losses are expected to be from the town of Lahaina, which sustained a catastrophic urban conflagration in the span of 12 hours that burned more than 2,100 acres (850 hectares) and destroyed almost 2,200 structures.
Moody’s RMS noted that several extenuating factors can drive losses higher than simple insured value estimates. “Post-event loss amplification is expected to be high in this event due to the island effect on supply chains, high construction labor costs in general, inflationary impacts during the expected long recovery time, and potential ordinance and law requirements,” said Rajkiran Vojjala, Vice President Modeling, Moody’s RMS.
The loss estimation process used by Moody’s RMS leveraged building-level damage assessments from multiple sources including analysis of satellite and aerial imagery in the worst-affected areas, as well as damage maps from the Maui Emergency Management Agency published on Aug 11, 2023. The estimate also includes various sources of post-event loss amplification (PLA) and potential for coverage expansion noted after major wildfires on the U.S. mainland in recent years.
While the economic loss estimate reflects direct and indirect losses from damage to physical assets, it does not consider macroeconomic factors such as expected reduction in the island’s Gross Domestic Product (GDP), government payments, or additional social costs due to the wildfires.
Concentrated Damages
In its report, AM Best provided a list of the top writers of property lines in Hawaii based on direct written premiums.
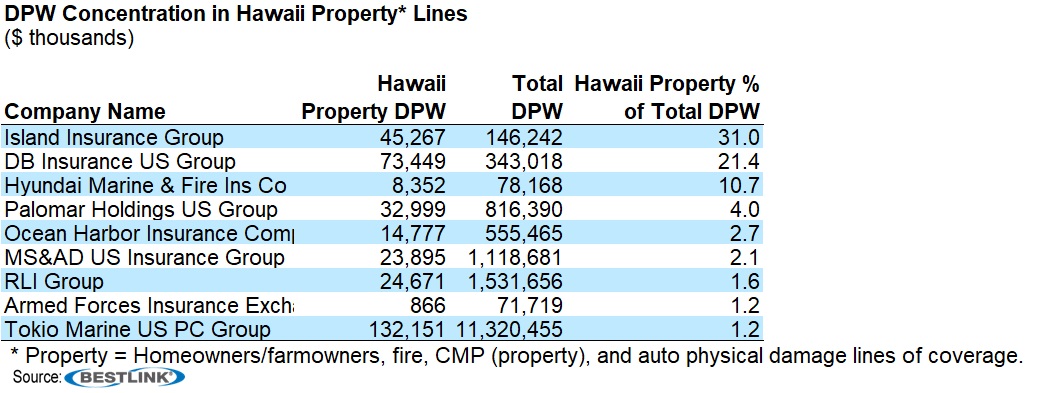
“As devastating as the damages are, they are relatively contained geographically,” Best said, noting that large carriers with geographic spread across the continental United States will likely have the capital and reinsurance coverage to absorb losses.
On the other hand, “the capital plans, reinsurance, and enterprise risk management programs of smaller carriers will likely be severely impacted,” AM Best said, noting, however, that only three—Island Insurance Group, DB Insurance US Group (a unit of Seoul, Korea-based DB Insurance) and Hyundai Marine & Fire (also part of a Seoul, Korea based group)—had more than 10 percent of their premium volume in Hawaii.
The AM Best commentary also notes that carriers dealing with claims related to the Maui wildfire will likely face supply shortages and pricing volatility with regard to providing available dwellings for temporary use—hotel rooms or rental platforms such as Airbnb or VRBO. The report highlights further supply chain and inflationary cost issues related to materials for rebuilding. “The demand surge for such materials will increase the cost precipitously of rebuilding as well as retrofitting existing structures,” said Raymond Thomson, associate director, AM Best.
Wildfire Mitigation
One potential mitigating factor for insurers is the possibility of subrogation recoveries from utilities, AM Best noted, also stressing that investigations into the origin of the fires are in progress. Still, “similarities are being drawn to the situation with PG&E regarding the 2018 California wildfires,” Best said, noting that if investigators find that power lines were the cause, and that power companies failed to take effective risk mitigation prior to the wildfire breakout, litigation could result.
Speaking more generally about wildfire mitigation in an RMS media statement, Michael Young, Vice President, Product Management, Moody’s RMS, noted: “When the rare situation of high wind and wildfire ignitions do occur again in the future, we need to be sure all the buildings comply with scientifically proven risk reduction features highlighted in programs such as the Wildfire Prepared Home program from Insurance Institute of Business and Home Safety.”
During a separate interview with Carrier Management early this month, which took place before the devastation in Hawaii, Young spoke about a partnership between Moody’s RMS and IBHS that is aimed squarely at analyzing features that will minimize damage to property in a wildfire.
While many images from Hawaii show 100 percent loss to properties, total loss has not been a given in other wildfire events, Young reported.
“This is one of the interesting facts when we look at the data itself of recent fires—that about 40 to 60 percent of the buildings in a given fire footprint actually survive,” he said. “A footprint is literally just a boundary around things where the fire has gone in many different paths. And there are ways of escaping fire,” he said, referring to pioneering research that IBHS has done for the last two decades, doing “side-by-side tests that show, the way you construct a building can reduce the likelihood of igniting during a wildfire.”
Said Young, “If you’re able to let the wildfire pass in the 15 or 20 minutes that the front goes through a town or community, then your chances of surviving are actually quite high,” stressing, however, that people should evacuate nonetheless.
Carrier Management interviewed Young to understand how catastrophe models can be used to determine insurance rates, as well as credits for risk mitigation activities. CM spoke to Young a few weeks after he and other representatives of catastrophe modeling and wildfire risk scoring firms testified at a workshop hosted by the California Department of Insurance calling for public input on technical and legal questions surrounding the use of catastrophe models for pricing wildfire risks. (Related article: Viewpoint: California’s Next Steps on Cat Models, Challenges and Issues in Insurance Ratemaking)
During the hearing, Young addressed a key question of how cat models could be used for ratemaking in California while meeting a longstanding rule in the state requiring that all information provided to the commissioner for rate approval “shall be available for public inspection.” Among other ideas, he advocated the ideas of the department accessing modeling documentation that RMS and other modelers have provided to the NAIC Catastrophe Modeling Center of Excellence, or alternatively appointing a third-party ombudsman to access the information.
Speaking with Carrier Management, Young addressed more basic questions about the use of cat models for base rates and mitigation credits, explaining that the idea that cat models only provide aggregate portfolio view of risks is a misconception. While Moody’s RMS and other cat modelers do provide probable maximum losses and average annual losses for portfolios of property business that carriers could use for reinsurance purchasing or for rating agency and solvency assessment, “in order to get the aggregate right, you’ve really got to pay attention to all the parts,” Young said.
“The best of our models are starting out at trying to predict what we think is happening at a location level. That’s super critical if you’re actually going to try and figure out what the impact of different mitigation devices could be, or different ways of modifying the risk,” he said, noting that the models capture changes on a property-by-property basis. “Then you can see how it all rolls up and adds up together,” he said.
Young also discussed the difference between cat models and wildfire risk scoring models recently developed by InsurTechs in the context of assessing the impacts of wildfire mitigation activities. “There are a variety of companies out there that are doing just pure hazard scoring mechanisms. They’ll compile something and say, ‘Here’s the burn probability, or here’s the likelihood of fire coming into a neighborhood or being within a hundred miles of the house…And they’ll turn that into some kind of a score.”
“The best application for us, and what we advise our clients is that if you can derive a score based on the loss expectation from the [catastrophe] model, that is going to be far more predictive of [the] individual building performance than just the hazard,” he said. “The hazard without knowing what the impact of the building is—there’s a disjoint there,” he said.
***
Photos provided by EagleView Technologies.
EagleView Technologies Inc, a provider in aerial imagery, routinely flies over areas impacted by severe weather as part of their government-focused Disaster Recovery Program. The aerial images help citizens, local governments, insurance carriers, and community organizations understand how to triage and respond to the devastation.
 Global Commercial Insurance Rates Keep Falling; Down 8 Quarters in a Row
  The Impact of Subsidization on Commercial Auto Telematics Programs
  Dealer Installed Anti-Theft System Puts More Than 2M Vehicles in California at Higher Theft Risk
  This Year’s SCS Loss Totals Will Fall Below Average: KCC Analysis