Although market leaders in the directors and officers liability insurance segment have stayed relatively unchanged in recent years, CNA edged its way into the top five last year, according to a ranking prepared by Fitch Ratings.
The ranking of the top 10 D&O insurers based on direct premiums written included in Fitch’s “Directors and Officers Liability Dashboard” report, shows CNA with 7 percent share of the market. That puts it in fourth place on a market share ranking, up from sixth in 2013.
A prior report from Fitch (published in 2013) showed that CNA had a seventh-place ranking in 2012.
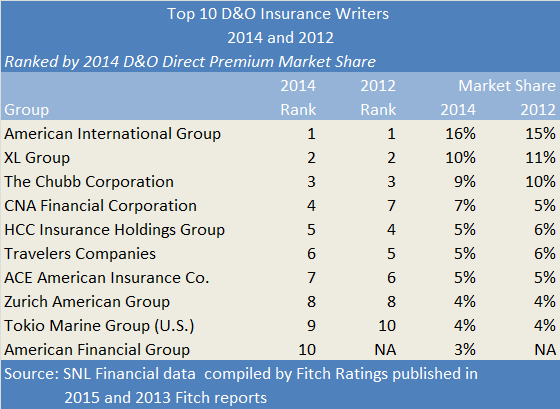
The D&O lineup remains tightly concentrated with the top three players—American International Group, XL Group and Chubb—representing 35 percent of the market. The top five D&O writers capture half of the total direct D&O premiums for the industry, and the top 10 garner almost 70 percent.
Overall, industry direct written premiums for the D&O line rose 9 percent last year, and loss ratios are improving, Fitch reported.
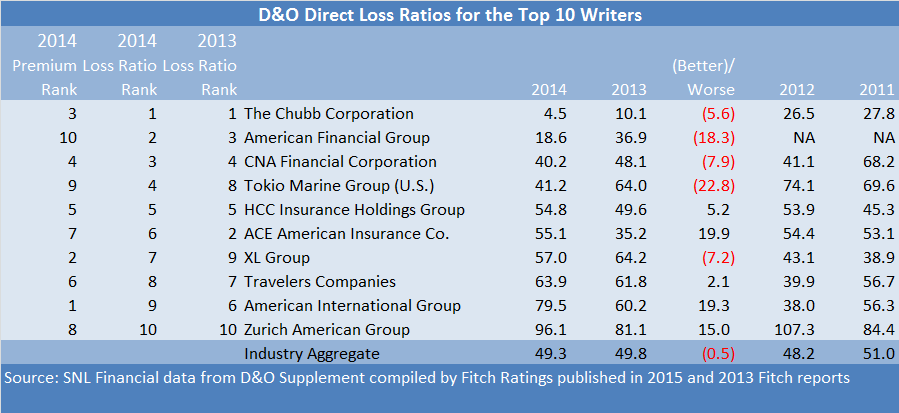
Fitch’s analysis is based on a compilation of annual statement supplement data which has been required to be filed by D&O insurers with insurance regulators since 2011. Combining data for losses with the premium data, Fitch reports an industry aggregate direct D&O loss ratio of 49.3 for 2014, compared to 49.6 for 2013.
“Contributing to the stable loss ratio is a continuation of declining claims and claims costs,” Fitch said in a statement about the report.
The loss and premium information filed in the D&O supplement are presented on a direct basis—before deductions for ceded reinsurance. In addition, the supplement data does not include loss adjustment or underwriting expenses, which would be needed to estimate net combined ratios for the line.
Still, Fitch was able to present a more complete picture of overall underwriting losses, by looking at annual statement for the other liability-claims made segment (which includes D&O and professional liability written on a claims-made basis). That analysis indicates that the 2014 accident-year loss and loss adjustment expense ratio fell to its lowest level in seven years in 2014—68.2, compared to 70.5 in 2013. This ratio exceeded 75 back in 2011, the report shows.
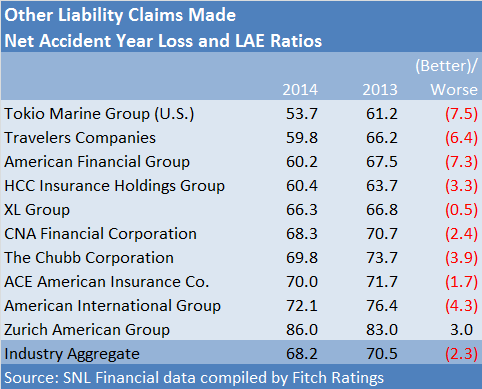
Individually, results for the top 10 writers of D&O insurance are uneven, according to data presented in the Fitch report—both in terms of direct loss ratios from the supplement data and the proxy net accident-year loss and loss adjustment expense data for all claims-made liability business. The report shows:
- Direct calendar-year loss ratios for the D&O line ranging from a low of 4.5 for Chubb to a high of 96.1 for Zurich American in 2014.
- While the direct D&O loss ratios for both insurers have improved since 2011, Chubb has consistently reported the lowest loss ratio for the four years, and Zurich the highest.
- Net accident-year combined ratios for the other liability-claims made segment ranging from a low 53.7 for Tokio Marine to a high of 86.0 for Zurich American.
A comparison for premium data in the latest Fitch report with similar data in a prior report (published in 2013) reveals that CNA leapfrogged over HCC, Travelers and ACE between 2012 and 2014 to take the No. 4 ranking last year.
Another change occurred at the bottom of the top 10 list, with American Financial Group joining the ranks of the top 10 ranks and AXIS dropping off the list.
In the latest report, Fitch also analyzed loss reserve development for the other liability claims-made category using annual statement data, finding that development was favorable in each of the last five years for the industry overall. In fact, favorable development increased to 6 percent of industry calendar-year earned premiums in 2014 from 3.2 percent in 2013, Fitch reported.
On an accident-year basis, 2010–2013 exhibited loss ratio stability. The 2009 accident year developed unfavorably from recession-related losses, Fitch said.


 Beazley Agrees to Zurich’s Sweetened £8 Billion Takeover Bid
  Flood Risk Misconceptions Drive Underinsurance: Chubb
  Insurance Groundhogs Warming Up to Market Changes
  Experts Say It’s Difficult to Tie AI to Layoffs


