


Inflation, defined as the rate at which prices for goods and services are increasing, tends to occur when prices rise due to increases in production costs or when the demand for a product exceeds its supply (i.e., too much money is chasing too few goods). Since 1990, the U.S. inflation rate, as measured by the CPI (consumer price index), has not exceeded 4 percent; in 2019 and 2020, the increase in the CPI averaged less than 1.9 percent. However, the infusion of trillions of dollars into the financial system in response to the recession brought on by the coronavirus pandemic has prompted renewed concerns that inflation could be around the corner.
Executive Summary
In 2020, the all-items CPI inflation was only 1.4 percent, and the projection for 2021 is around 2.2 percent. But some worry that the high levels of inflation that the U.S. experienced in the 1970s are around the corner as the nation recovers from the shuttered businesses and unemployment levels brought about by COVID closures. Here, Conning’s director of insurance research, Bill Burns, reviews the factors that triggered inflation in past decades and outlines how three areas of P/C insurance—loss reserving, pricing and investing—are impacted by changes in inflation rates.This article was previously published in the February 2021 issue of THE CONNING COMMENTARY and is being published by Carrier Management with permission.
A Brief History
From 1973 until 1982, CPI inflation ranged from 6 percent to almost 14 percent. Inflation in the early 1970s was partly due to surges in the price of oil, while measures taken to curtail inflation included wage and price freezes, surcharges on imports, and a break with the gold standard. In further attempts to rein in inflation in the late 1970s, the Federal Reserve, under Chairman Paul Volcker, implemented tight monetary policies that raised the federal funds rate from 10 percent to 20 percent. While these actions resulted in a recession, the policy proved effective. The money supply was reduced, prices dropped, and in 1982 inflation broke.
Since 1982, the Fed has gone through several more periods of tight money. The most recent such period started in June 2004, when the Fed began raising rates to address concerns about the housing bubble. This period lasted until August 2006 and, like the other periods of tight monetary policy, the Fed was able to bring inflation under control.
An Unexpected Surge of Money
The last significant financial crisis the U.S. experienced was the Great Recession of 2008. The triggering event of this recession was the burst of the housing bubble that occurred in 2005-2006. In response to the crisis, the federal government created an array of solutions that were designed to stabilize the economy. One solution was the TARP (Troubled Asset Repurchase Program), which authorized the Treasury to purchase up to $700 billion in mortgage-backed securities from U.S. banks and to purchase stock in banks, insurance companies and other institutions.
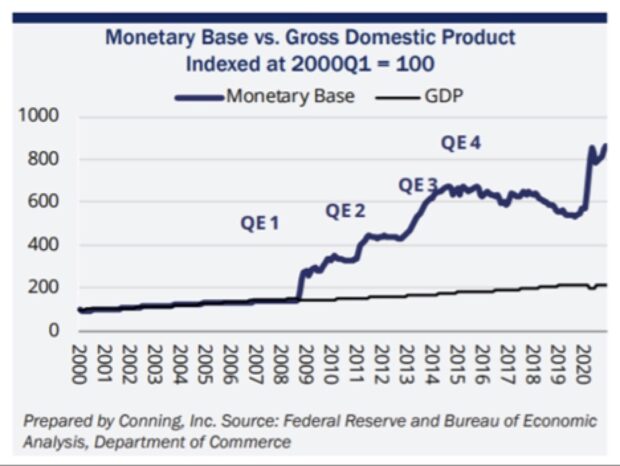
In addition to TARP and other relief programs, the Fed also expanded its open market operations through quantitative easing. QE is a monetary policy that allowed the Fed to purchase government bonds and other assets to inject money into the economy and expand economic activity. Between November 2008 and September 2012, the Fed implemented three rounds of QE (known as QE1, QE2 and QE3), which had the effect of increasing the Fed’s assets from $900 billion in 2008 to $4 trillion at the end of 2013.
When QE was first introduced, there was fear it would lead to runaway inflation (think Zimbabwe, when, at its peak, inflation was 98 percent per day). However, QE was implemented when the U.S. economy was already deflationary. Further, much of the money was not put into circulation; rather, it was held by banks. Consequently, it was not a case of money chasing goods that typically leads to inflation. (The situation in the U.S. was also materially different than that of Zimbabwe. The former remained productive while the supply of money increased, whereas the latter printed money to try to prop up a crumbling economy that had an unemployment rate of almost 80 percent.)
Are We Heading for Inflation in 2021?
As a result of the COVID-19 pandemic, thousands of businesses were forced to temporarily (then permanently) close their doors, more than 20 million people filed for unemployment, and the Dow Jones dropped more than 35 percent between February and March 2020. To combat the deleterious economic effects of the pandemic, Congress passed a series of stimulus bills designed to support businesses and families. To date, policymakers have committed trillions of dollars of financial support, including the $2.2 trillion CARES Act and $900 billion of additional stimulus in December. The Fed has contributed more than $2 trillion through various actions (loans, asset purchases, etc.), and the enactment of a third round of stimulus checks in March added another $1.9 trillion to the tally.
As seen in the accompanying graph, the massive amounts of stimulus since 2008 have not resulted in similar growth in GDP, nor have they resulted in increases in inflation. In 2020, the all-items CPI inflation was only 1.4 percent, and the projection for 2021 is around 2.2 percent.
Will this last? Or is inflation waiting around the corner?
The Federal Reserve said in 2020 that it is willing to allow inflation to exceed its target rate of 2 percent for a while to make up for the period it has fallen short of that mark. The Fed’s willingness to “juice” the inflation rate is a reversal from its role as an inflation fighter. Over the long term, the Fed expects inflation to be anchored at 2 percent; in the short term, this strategy could have the benefit of raising wages and lead to a higher standard of living for many Americans.
There is no single—or even correct—answer to this question, and arguments can be made to support either contention. For example, one widely held view (compliments of Milton Friedman) suggests that the sheer amount of money created by the government will push prices up. A counterargument points out that the velocity of money (i.e., the frequency with which money changes hands as people buy goods and services) decreased during the pandemic because people are saving more and spending less (which dampens inflation). Another argument supporting inflation says that household wealth has increased and that demand and inflation will increase when the hibernation brought on by the pandemic subsides. The anti-argument says that, while people are saving more today because they have fewer places to spend money, they might have longer-lasting fears of flying, eating in restaurants, etc., and that the demand for goods will not increase enough to drive up inflation.
What Does This Mean for the Property/Casualty Industry?
As with most financial institutions, higher-than-expected inflation has adverse effects on the results of property/casualty insurers. The risk to insurers falls in three buckets:
Liabilities. Insurers carry liabilities in the form of loss reserves that are intended to pay claims in the future. If inflation is higher than the rate built into the loss reserves, then future payments will be greater than expected. The impact of inflation varies by line of business, but an increase of 1 percent in inflation can raise the P/C industry combined ratio by two to three points. For personal lines of business, where liabilities are short in duration, a 1 percent increase in inflation may increase the combined ratio by less than one point. For a long-tailed line of business such as medical professional liability, the same 1 percent hike in inflation may increase the combined ratio by more than five points.
Pricing. Insurers charge prices today that will pay for future claims. If inflation proves to be greater than the inflation rate anticipated in the prices, then insurers may not have sufficient funds to pay claims. The dynamics of underestimating the inflation rate built into prices is like that of liabilities—i.e., a 1 percent increase in inflation will result in overall prices inadequacies of 2-3 percent (which varies by line of business).
When setting liabilities and pricing business, insurers must be sure to look at the components of the losses and use inflation rates that reflect the payments that will be made. For example, workers compensation losses, on average, consist of 50 percent for medical payments and 50 percent for lost wages. If the overall annual CPI inflation rates for medical costs and wages are 3 percent and 2 percent, respectively, then an annual trend rate of 2.5 percent is reasonable. However, if the insurer writes more professional services classes of business in areas with high costs of living, then the inflation rate for wages may be closer to 4 percent and the average annual trend rate should be 3.5 percent.
Investments. Approximately 80 percent of the assets held by the P/C industry are in fixed income instruments such as Treasury, municipal and other bonds. These assets are structured to match the payments (cash flows) of the loss reserve liabilities they support. If companies sell current bonds so they can invest in newer, higher-yielding bonds, they will have to book losses upon the sale because higher interest rates drive down bond prices. However, if they hold onto current assets while the ultimate values of the underlying loss liabilities are increasing, then companies will have a mismatch between their assets and liabilities. This mismatch would have to be accounted for by a reduction in the company’s surplus. There is no efficient way for companies to hedge inflation risk, but they can try to dampen the risk through holding assets such as stocks and real estate (which bring their own inherent risks to a balance sheet).
Let Us Not Forget…
The CPI and other economic indices such as the PPI (producer price index) are valuable resources, but arguments have been made that these indices have inherent flaws that can distort their measures of inflation. For example, the CPI is heavily weighted toward urban consumption and may not be an accurate measure of the price of goods for suburban and urban areas where prices may be higher due to distance from production centers. The CPI is also criticized for not representing the innovation of new products that could be years away from inclusion in the calculation of the CPI.
Another item critical to the insurance industry that is not included in any of the indices is potentially the largest inflation factor of all: social inflation. While there is a clear trend in rising claim costs for liability lines of business, the overall increase in costs has been higher than the inflation in underlying costs such as medical care and motor vehicle repair. By definition, social inflation is difficult if not impossible to measure because of its qualitative nature (i.e., anti-corporate sentiment, changing societal views, desensitization to large verdicts). However, to the extent social inflation is contributing to claim costs, insurers and reinsurers must attempt to quantify its impact so liabilities and prices are adequate.
According to different sources, the U.S. CPI inflation rate is projected to be between 2.0 percent and 2.5 percent over the next several years. While insurers have been raising prices in response to rising costs, it remains to be seen if increases in loss reserves will follow. The industry’s carried liabilities for general liability and commercial auto liability have been deficient for the past several years. If inflation is greater than expected, these deficiencies will likely grow.
 Soft P/C Market May Be Shallower Than Previous Cycles: Swiss Re
  The Hanover Announces CEO Succession Plan; Roche to Retire at End of 2026
  Self-Driving Car Firms Must Address Emergency Vehicle Interference
  Two Trailers Containing $1.3M in Stolen Copper Wire Recovered in Illinois