


Overall profit for the U.S. property/casualty insurance industry should pass the $50 billion mark for 2014, according to estimates presented by the president of the Insurance Information Institute on Wednesday.
Speaking during a media briefing about 2014 natural catastrophes and the financial impact on the industry, which was conducted jointly by I.I.I. and Munich Re, Robert Hartwig also said that the estimated $50.3 billion figure for net income after taxes is the second highest since the financial crisis—surpassed only by a $63.8 billion profit number for 2013.
Consistent with the theme of the webinar, Hartwig pointed to lower levels of natural catastrophes in both years as one key reason for the results. “Catastrophe losses or the lack thereof are defining events in determining the profitability of the industry,” Hartwig said as he displayed a graph showing peaks and valleys in ROEs (returns on equity) from 1987-2014 with callouts indicating the drivers of some of the highest and lowest points:
- For 2013, the flag “Low CATS” corresponded to a year with a 9.8 percent ROE for the industry excluding mortgage and financial guaranty insurers.
- In 2012, “Superstorm Sandy” losses dented profits, bringing the ROE down to a 6.2 percent figure on a comparable basis.
- For 2011, the slide says “Record Tornado Losses” next to an ROE figure of just 4.7 percent.
The net profit figure estimate for 2014 together with an estimated record surplus level of $675 billion will produce an ROE of 7.7 percent for the U.S. P/C industry in 2014, according to Hartwig’s presentation slides, or roughly 7.6 percent including the guarantors.
Explaining the dip from roughly 10 percent in 2013, Hartwig said both a lower level of investment income and modestly higher catastrophe losses played a role.
With 70 percent of their investments in bonds and yields on invested assets down around 3.3 percent, Hartwig said the investment income portion of the $50 billion profit total is estimated to come in around $45.7 billion (referencing yield figures from Conning). In 2013, investment income was 47.4 billion, he reported.
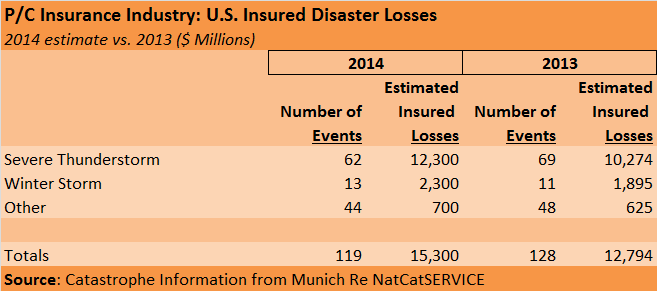
According to Munich Re’s NatCatSERVICE, U.S. catastrophe losses were roughly $15.3 billion in 2014, Carl Hedde, Head of Risk Accumulation for Munich Reinsurance America, reported, also noting that 80 percent of that total came from severe thunderstorm losses. A similar Munich Re presentation last year revealed that there were actually more natural catastrophe events in the U.S. in 2013—128 vs. 119 in 2014. But $2.3 billion of winter storm losses in 2014 and $12.3 billion in thunderstorm losses helped push the total insured loss dollar total above 2013’s $12.8 billion.
While catastrophe losses and investment income do not fully explain the year-to-year swings of overall profit figures for the industry, Hartwig provided a history of both investment income levels and the combined ratio impacts of catastrophe losses for the last decade. Figures for 2005-2014 are summarized below.
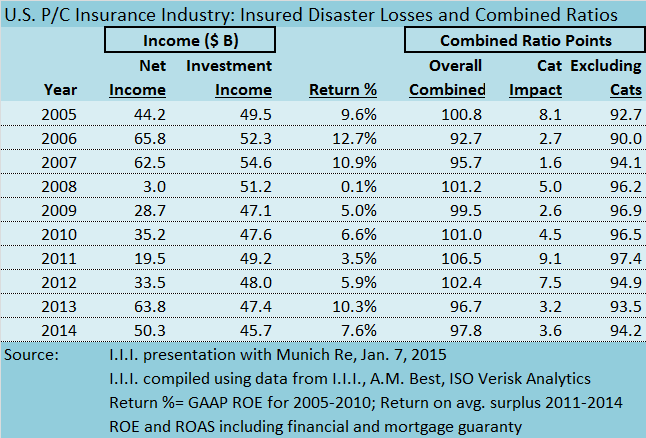
Putting forth an estimated combined ratio of 97.8 for 2014, Hartwig said the industry would record two straight years of underwriting profit, marking the first instance of back-to-back combined ratios below 100 since 2006 and 2007.
U.S. P/C insurance premium growth, he said, will come in at just about 4.0 percent for the year.
Weather Milestones and Climate Change
Leading off the webinar with their discussion of natural catastrophe losses—in the United States and around the globe—Hedde and Ernst Rauch, Head of Corporate Climate Centre for Munich Re, delivered reports on a string of weather records as well.
Hedde said:
- Despite the late onset of the tornado season, the insured thunderstorm loss total of $12.3 billion in the U.S. was the fourth highest annual total on record.
- The eastern United States experienced its coldest winter in over a decade last year, with resulting 2014 insured damages estimated to exceed $2.3 billion.
- Worldwide, Munich Re counted 980 natural catastrophe events for 2014, representing the largest number in the last decade.
- The Napa earthquake in 2014 was the largest California earthquake since Northridge.
- In each of the years 1983 through 2013, the top event was an earthquake.
- In spite of the record number of global events, the number of fatalities—7,700—was much lower than 2013’s count of roughly 21,000 and also well below the average figures of the past 10 and 30 years (97,000 and 56,000, respectively).
“Providing people with relevant information helped in reducing the number of fatalities,” Rauch said, citing the impacts of forecasts and evacuations in saving lives. “What we would like to see is that property losses should also be reduced by improving resilience,” he added.
Throughout the presentation, both Hedde and Rauch commented repeatedly on the growing incidence of extreme precipitation events throughout the globe: too much in places like Eastern Europe in May, and even in large U.S. cities like Phoenix and Detroit; too little in Brazil and California, causing drought conditions.
Rauch displayed maps and charts of historical and recent temperature and rainfall patterns, with an eye toward answering the question of whether experts can pinpoint anthropogenic climate change (caused by human activity) as the driver of such events. In response to a question from a journalist about a perceived pickup in out-of-the ordinary events like these—and in particular, a record snow event in Buffalo, N.Y. last year—Rauch echoed Munich Re experts who addressed similar questions during last year’s webinar. No one event or single year is proof positive of the impact of greenhouse gas emissions, the Munich Re representatives said during both webinars.
“By definition, climate is considered to be an average over 30 years,” Rauch said.
In January 2014, Peter Höppe, Head of Geo Risks Research at Munich Re, responded similarly. “I wouldn’t take 2013 as proving global warming,” he said. “We have some heat records, convective storms, [but] each of these could have happened without climate change…2013, I wouldn’t say, has been a year that brings more evidence in reference to more weather extremes.”
But addressing a longer period of time, Rauch seemed to have some of the same questions as the journalists. “What is clear is that over the last decade, if you go back over 10, 20, 30 years [prior], we indeed have seen in many regions of the world very unusual events…that we did not record [before]. The question remains: Are these events just outliers in a statistical sense? Or have we entered into a new normal situation?”
He continued: “At this point in time, it’s simply too early to link any of these events—at least from our data—to climate change. We cannot answer the question [of whether[ the snowfall event or cold spell last year in U.S., or forthcoming one, is linked to global warming or not. Science around this question is evolving.”
But Rauch has a hunch they are linked, he revealed when discussing an abnormal heat wave in Europe in 2003. “Is this already climate change? Probably yes, but we cannot answer this question in a pure scientific sense.”
Earlier, during his presentation on the severe precipitation deficit in California, Rauch reviewed two trends related to drought conditions: annual variability in California winter precipitation amounts and average temperatures since 1895. While reporting no real long-term trend from the annual precipitation analysis, he said that both summer and winter temperatures over the last 100 years “changed to warmer regimes.”
“2014 was one of the warmest years since the beginning of records—winter and summer,” he added.
He explained that when consistently warmer temperatures combine with a few years of low levels of precipitation, the result is a condition known as evapotranspiration. “Whatever came down [in the form of rain] disappeared very quickly due to the high temperatures.”
Returning to the overriding question—did anthropogenic climate change contribute to the California drought?—Rauch responded to his own question this way: “The brief answer here is that obviously when it comes to the precipitation pattern, no, we have not seen a trend either upwards or downwards. But when it comes to temperature development, yes, there is a clear upward trend—and this is most likely caused and driven by anthropogenic activities and increasing greenhouse gases.
“The result is that to some extent it is reasonable to argue that anthropogenic climate change has already contributed to the drought situation in California.“
 Retired NASCAR Driver Greg Biffle Wasn’t Piloting Plane Before Deadly Crash
  20,000 AI Users at Travelers Prep for Innovation 2.0; Claims Call Centers Cut
  Earnings Wrap-Up: AXIS Expanding Insurance Biz, Shrinking Re Book
  Nearly 26.2M Workers Are Expected to Miss Work on Super Bowl Monday


