


In separate analyses published yesterday, both AM Best and Fitch Ratings reported double-digit drops in operating income for North American property/casualty insurers through nine months but said combined ratios stayed below 100 in spite of heavy catastrophe losses.
According to AM Best’s analysis, which is based on interim statutory statements for U.S. P/C insurers writing 97 percent of the industry’s net written premiums, pretax operating income dropped 17.1 percent to $38.5 billion. The underwriting income component of operating income plummeted 86.4 percent to $0.6 billion from $4.5 billion for the first nine months of 2019. The larger investment income component declined 7.4 percent to $37.7 billion.
In spite of the more than 86 percent drop in pretax underwriting income, the industry combined ratios only moved 0.7 points to 98.7 for the first nine months of 2020, compared to 98.0 for the comparable 2019 period, according to AM Best’s tally.
Fitch put its calculation of the nine-month combined ratio at 96.9, 1.7 points above its 2019 figure of 95.2, basing its analysis on GAAP results for 50 North American insurers and reinsurers. Using the GAAP financials for the 50-group cohort, Fitch said that losses from the ongoing coronavirus pandemic and an unusual frequency of catastrophe events contributed to a 25 percent decline in nine-month GAAP operating income.
With cats events including a series of landfalling hurricanes, a Midwest derecho, hail and thunderstorms, as well as wildfire activity—several of which will produce $1 billion or more in losses—and $7.7 billion of COVID losses for the group contributing to lower underwriting profits, Fitch put the nine-month loss ratio at 69.2, or 1.3 points above the nine-month 2019 loss ratio of 67.9.
The AM Best analysis shows higher loss ratios for both periods, but actually puts the 2020 figure 0.3 points lower than 2019, estimating the nine-month 2020 loss and loss adjustment expense ratio to be 70.5.
According to AM Best, cat losses accounted to 8.3 points of the 2020 loss ratio, compared to just 4.4 points in the same period for 2019.
Drilling down further into the dollar amounts behind the underwriting ratios, the report reveals that while net earned premiums increased roughly 12.4 billion (or 2.7 percent) to $466 billion, losses and LAE together with underwriting expenses grew $13 billion (or 2.9 percent) to $459.9. The Best analysis also includes policyholder dividends of $5.6 billion—more than double the nine-month 2019 figure of $2.3 billion, turning an underwriting profit of $6.2 billion before dividends to the $0.6 billion underwriting profit after dividends.
In addition to policyholder dividends, the report notes that some insurers reported COVID-19 related voluntary premium refunds as underwriting expenses and others as premium reductions, somewhat complicating the analysis.
During the nine-month period, underwriting expenses increased by 4.4 percent as some P/C companies recorded policyholder credits as an underwriting expense rather than a reduction of premium. Dividends to policyholders rose $3.2 billion from the prior-year period, as other companies provided refunds in the form of dividend payments. These factors, along with the increase in incurred losses and loss adjustment expenses, led to the 86 percent net underwriting income decline.
The AM Best report notes that the statutory underwriting results improved overall for personal lines but deteriorated for commercial and reinsurance segments.
Fitch gives a more specific breakdown of GAAP results by segment on a calendar-year basis:
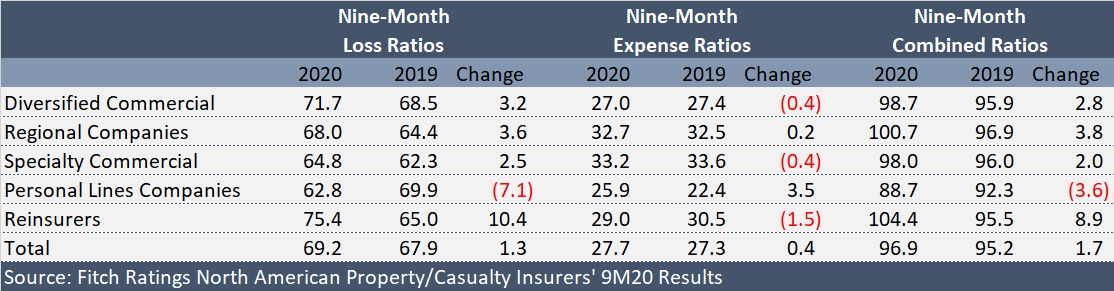
The Fitch report also includes results for these categories on an accident-year basis, results for Florida homeowners insurers and individual results by insurer for each of the 50 companies included in the report.
 The Impact of Subsidization on Commercial Auto Telematics Programs
  This Year’s SCS Loss Totals Will Fall Below Average: KCC Analysis
  Liberty Mutual Introduces Its Newest Brand Character: Liberty Biberty
  Your Greatest Competitive Advantage Isn’t Technology—It’s Leaders