


After a whirl of shifting trends throughout the pandemic, personal auto insurers are seeing forces converge toward a hard market in 2022. The turbulence has been deep and widespread:
1. Contraction and volatility in 2020: Amid the pandemic and stay-at-home orders, the personal auto market contracted in 2020 by about $11.5 billion worth of policyholder dividends, rebates, and refunds, which came on top of significant rate reductions.[1] This differed from a typical hard-market contraction driven by tighter underwriting standards and lower overall industry capacity. And since the premium insurers returned early in the pandemic coincided with lower mileage and fewer accidents, many profited even with the contraction.
Mileage rebounded to single-digit percentage declines against pre-pandemic levels. But recovery was from a maximum drop of more than 40 percent when the 2020 lockdowns obliterated the customary rush hour.[2] Interstate data shows extreme impacts on private passenger vehicle mileage followed by a slower recovery than commercial mileage.
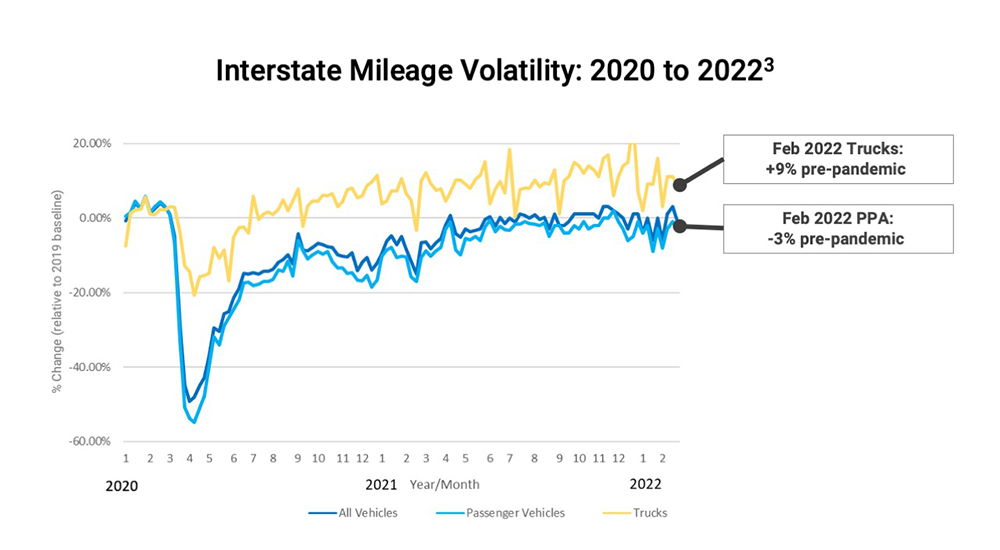
Ultimately, including lost opportunity costs, the pandemic may have shrunk premiums in the 2020 personal auto market by more than 6.5 percent.[4] And mileage, combined with factors that emerged later in the pandemic, has played a complex role in the industry’s heightened premium leakage concerns.
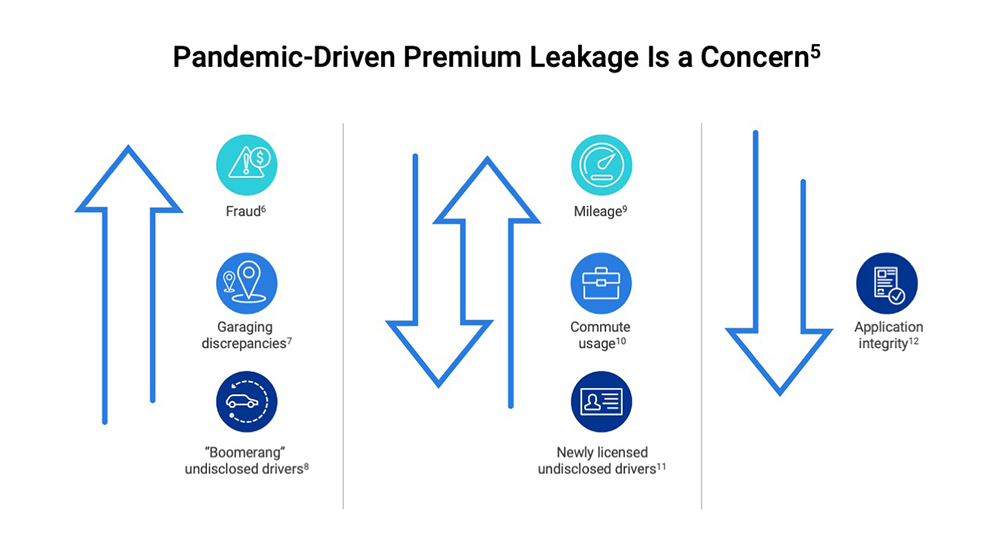
2. 2021 premium leakage: Recovery from 2020’s market contraction changed the picture in 2021, but pandemic-driven premium leakage emerged as a new challenge. The graphic below shows up-and-down mileage trends that nearly returned to historical patterns, helping to drive the leakage problem. More young adults moved back home, and regulators continued to scrutinize rate increase filings. Meanwhile, fraud trends increased while application integrity declined.
Many insurers are doing little to re-underwrite at renewal and realign pricing to the shifting risk exposures of the pandemic’s later stages. Policyholders who sought discounts in 2020 or experienced significant lifestyle changes may have been slower to alert insurers of more recent developments. Verisk data, therefore, shows rising premium leakage related to mileage and commute-usage rating variables, among other key rating factors, on many policies.
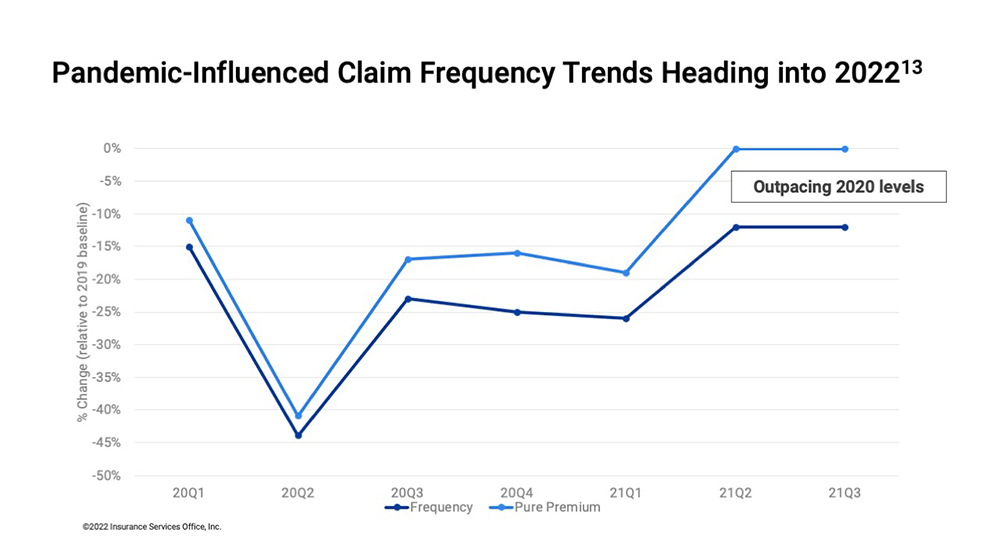
3. Frequency trends as 2022 unfolds: The general accident frequency trend has been slightly down compared with recent “normal” years, reflecting the greater presence of advanced driver assistance systems (ADAS) features in the total vehicle fleet.
But after initially dropping in the second quarter of 2020, frequency turned upward heading into 2022, based on available claim trend data.
Where might all of this lead?
Six hard-market trends that may define the near future
1. Signs of a soft market ending in 2021: While the pandemic’s Omicron wave interrupted some rebounding trends, claims increasingly took a turn that suggests a hard market for the industry in 2022.
The chart below shows rising frequency as more drivers return to the road more often, and claim severity continues to increase for reasons that will become clearer a bit later in this article. As a result, pure premium rebounded to pre-pandemic levels in the latest two consecutive quarters for which data is available.
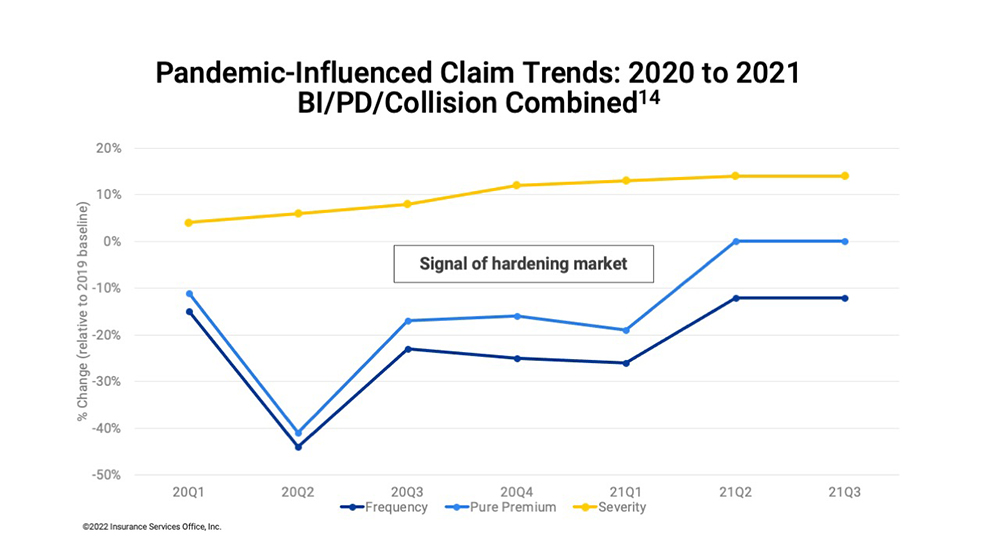
Claim severity rose even more for comprehensive coverages in Q3 of 2021— up 39 percent—with a boost from costly flood losses caused by Hurricane Ida in September 2021.[15]
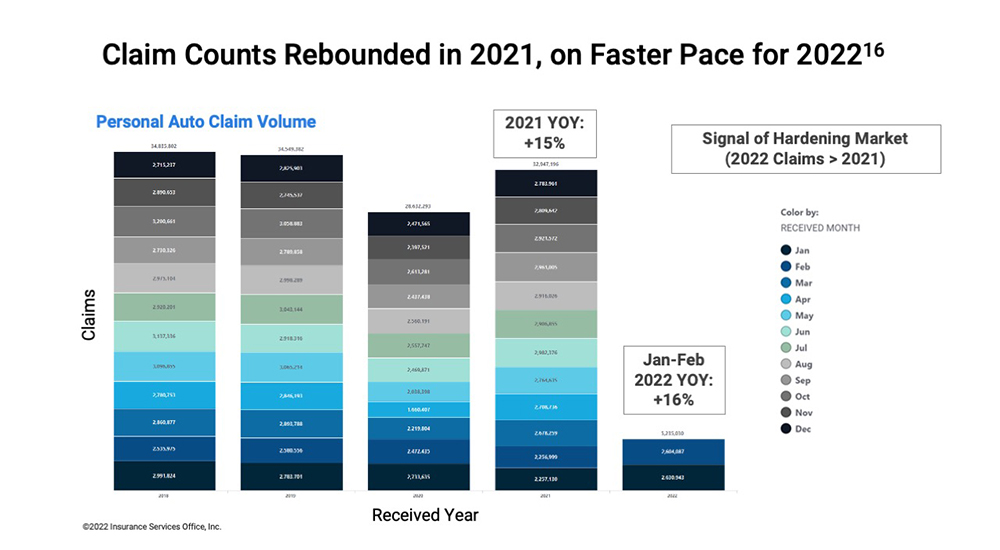
2. Hard-market indicators in early 2022: Data from Verisk’s ClaimSearch® shows a 15 percent rebound in claim counts, a leading indicator, for 2021, with a quickening year-over-year pace for the first two months of 2022.
3. Supply chain: Multiple, extreme disruptions for the industry include a shortage of computer chips.[17] Supply-chain impacts on parts availability and time to repair ultimately affect claim costs, as repair costs and car rental expenses rise.
4. Inflation: The Consumer Price Index for used cars and trucks is up more than 28 percent in the past two years, including six consecutive, record-setting months heading into 2022.[18] The cost of total-loss claims is rising as a result.
5. Riskier driving behavior: Riskier driving behavior that took hold after 2020’s pandemic lockdowns, and appeared to continue into 2021[19], may persist. U.S. Transportation Secretary Pete Buttigieg this year released a broad-based safety strategy.[20]
6. Digital expectations: The pandemic has accelerated the adoption of digital technologies by several years.[21] Insurers may need to transform to compete.
Possible ways to soften the hard market’s blows
It may take time cycle through the hard market, but insurers need not wait to boost profitable growth if they take proactive steps:
- Monitor trend and loss development to adapt rates over time. Long-run tracking and adjustments should ease abrupt impacts, while some insurers are seeking double-digit rate increases.[22] But this solution may face regulatory resistance after 2020 stretched many Americans financially.
- Shape up personal auto book health. Recover pandemic-driven premium leakage at renewal and true-up pricing on critical risk rating factors that may have changed significantly. Identify and recapture missing premium at renewal to help near-term profitability without depending on rate levels alone to achieve the needed premium. A free Verisk analysis can help identify sources of leakage and quantify potential recoveries.
- Accelerate digital transformation plans. With more new business likely flowing from online quotes, another path opens to identify fraud and improve rate integrity at point of quote.
- Encourage safe driving behavior via telematics. Driver feedback can help promote safety, while a driving score can help tie policy pricing to actual driving behavior and may be able to trigger safe-driving discounts at point of quote.
- Capture more accurate mileage. Recent enhancements can better measure this rating factor; learn how more precise mileage in its rating plan helped one insurer gain 7.2 percent lift.
- Cut underwriting report expenses with innovative tools. Cost-efficient personal auto risk indicators can help contain costs when used in front of an insurer’s full-report ordering workflow where there’s no adverse activity. In an expense-management ecosystem, insurers can also save on the Inflection™ credit-based insurance score, powered by Equifax credit data, at initial quote by only ordering the full score with reason codes when a quote moves to bind.*
- Leverage contributory data to support quick, efficient non-rate actions. No-integration batch jobs can use policy data that’s already being contributed to Verisk to help identify non-rate actions around potential fraud, unidentified drivers, and more. During initial underwriting or at renewal, these opportunities can help back-office and underwriting teams adjust rates with limited IT resources and lead times. This strategy can help align risk and boost short-term revenue in a hard-market environment.
Explore more ways to meet the hard market—and adapt to any environment the industry may face in the future. Download the new Verisk white paper, Innovation Strategies for Auto Insurance Underwriting: Accelerating Competitiveness with a Digital Insurance Ecosystem.
By David Ayers, Brad Magick, CPCU, and Dorothy Kelly
David Ayers, Director of Data Services at Verisk, is responsible for product development and innovation within the auto underwriting and point-of-sale space. Before joining Verisk, he had 17 years’ experience working at insurers in product management, pricing, underwriting, and claims, with a focus on new product development and automation.
Brad Magick, CPCU, leads the management of Verisk products for auto underwriting fraud, application and rate integrity, and book health. These products include Verisk’s RISK:check suite to help insurers mitigate fraud and confront premium leakage—a $29 billion annual problem for the industry. He oversees point-of-sale and renewal solutions, as well as advanced analytics that enable prioritized pursuit of premium recovery and policyholder outreach programs.
Dorothy Kelly, Vice President, leads product management within Verisk’s personal auto underwriting division and is part of a team helping insurers achieve profitable growth through data, analytics, and innovative underwriting tools. She has held leadership and executive roles within claims, underwriting, product management, and business development across personal and commercial lines, including co-founding a successful insurance services startup.
[1] Verisk analysis represents a full-year 2020 estimate based on insurers’ quarterly financial reports supplemented with their public statements and additional data sources, May 2021 Verisk’s Visualize, “Unpacking 2021’s New Normal in Personal Auto Mileage”, September 14, 2021
[2] Verisk’s Visualize, “Unpacking the 2021 New Normal in Personal Auto Mileage”, September 14, 2021
[3] Verisk analysis of Department of Transportation, Weekly Traffic Volume Report, 2021, preliminary estimates based on traffic monitoring roadway sensors and the Federal Highway Administration’s Performance Monitoring System
[4] Verisk’s Visualize, “2021 Personal Auto Growth and Profitability: Unprecedented in New Ways”, November 22, 2022
[5] Ibid.
[6] Verisk’s Visualize, “Personal Auto Research: Application Integrity Down, Fraud Up,” April 14, 2021; 6.4% of applications had one or more fraud triggers between 2013-2016 vs. 8.5% during 2017-2020
[7] Verisk client experience
[8] Pew Research Center, “A Majority of Young Adults in the U.S. Live with Their Parents for the First Time Since the Great Depression,” September 4, 2020
[9] Verisk’s Visualize, “Unpacking 2021’s New Normal in Personal Auto Mileage”, September 14, 2021
[10] Verisk client experience
[11] Property Casualty 360, “How Insurers Can Optimize Their Auto Book Health,” February 1, 2022
[12] Verisk’s Visualize, “Personal Auto Research: Application Integrity Down, Fraud Up,” April 14, 2021; 6.4% of applications had one or more fraud triggers between 2013-2016 vs. 8.5% during 2017-2020
[13] ISO statistical plan data, 2020-2021
[14] Ibid.
[15] Ibid.
[16] ClaimSearch data, March 2022
[17] CNN Business, “Auto Makers’ Problems Are Much Worse Than We Thought”, September 28, 2021
[18] Federal Reserve Bank of St. Louis (FRED), Consumer Price Index for All Urban Consumers: New and Used Motor Vehicles in U.S. City Average, March 2022, February 2020 to February 2022, record-setting months August 2021 to January 2022
[19] Verisk’s Visualize, “2021 Personal Auto Growth and Profitability: Unprecedented in New Ways”, November 22, 2022
[20] CBS News, “Buttigieg Vows to Act as Car Fatalities Spike”, January 27, 2022
[21] McKinsey, “How COVID-19 has Pushed Companies Over the Technology Tipping Point—and Transformed Business Forever”, October 5, 2020
[22] The Wall Street Journal, “Car Insurers Rush to Raise Rates as Inflation Takes a Toll”, February 9, 2022
*The InitialQuote Score is patented and trademarked by Equifax.
 Travelers Builds Insurance-Specific LLM
  East Coast Cities More Dangerous for Drivers According to New Allstate Report
  Most American Workers Are Checked Out, and Like ‘The Office,’ Their Bosses Are the Last to Know
  What Happens to Property Pricing in ’27, Insurance, Reinsurance Execs Ask