
 Benign catastrophe losses, combined with lower and less frequent casualty lines claims, helped Lloyd’s syndicates deliver another strong set of results in 2015, reporting an average combined ratio of 90 percent, according to a report published by Standard & Poor’s.
However, the industry is under growing pressure from strong competition, excess capacity, and softening rates – factors that have taken their toll on some syndicates, S&P indicated in its report titled “Bigger Lloyd’s Syndicates that Pursued Active Cycle Management Have Fared Best in Soft Market Conditions.”
Syndicates with the strongest underwriting performance tended to be bigger than underperformers and wrote a lot of catastrophe cover, thereby benefiting from lower, less frequent claims in 2015, said S&P. On the other hand, the worst performers were generally newer, smaller or had higher levels of liability exposures.
Best Performers
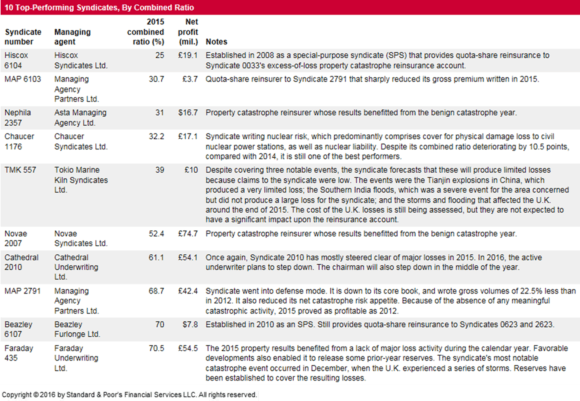
In an analysis of 94 syndicates that operated in 2014 and 2015, S&P found that syndicates with capacity of over £500 million ($724.3 million) all reported a combined ratio below 100 percent,* with an average combined ratio was 88 percent. (See S&P’s table below for the 10 top performing syndicates).
Of the syndicates analyzed by S&P, 29 (31 percent of S&P sample) disclosed that their combined ratios rose by more than 5 percentage points in 2015, compared with 2014.
“Many of the more successful syndicates have acted defensively by reducing their net catastrophic risk appetites in anticipation of possible lower returns,” said S&P, noting they have scaled back their lines of business and amount written, reverting to their core books.
Top performers were “mostly cautious and proactive in terms of cycle management, with good underwriting discipline,” said S&P, emphasizing that careful risk selection matters in a soft market.
Worst Performers
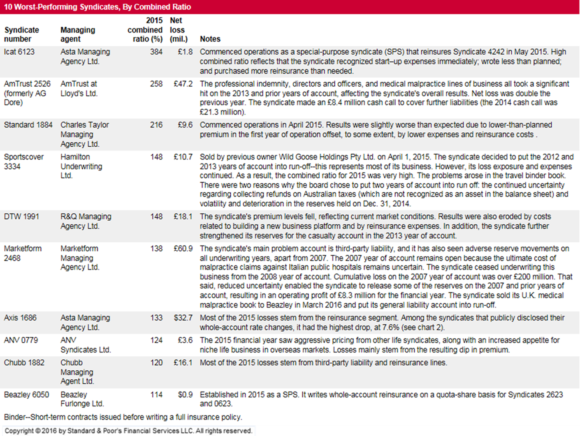
 The syndicates that reported the highest combined ratios – or the worst performers – were generally “smaller, newer or had higher-than-average liability line-of-business exposures,” the S&P report explained. (See S&P’s table below for the 10 worst-performing syndicates).New syndicates “are typically burdened by high start-up expenses when they enter the Lloyd’s market,” the report said, adding that three of the bottom 10 underperformers were new syndicates.
“Market challenges also caused rates to plummet further,” S&P said. “In the energy market, the slump in oil prices led to a scaling back in demand for insurance. Meanwhile the marine, aviation and property markets are still awash with sufficient capacity to defy loss experience.”
“The number of syndicates reporting combined ratios above 100 percent rose to 22 (23 percent) from 17 (18 percent) in 2014. Of these, nine syndicates reported a combined ratio of over 115 percent (defined as a disastrous year) in 2015,” the report noted. “The number of syndicates reporting a disastrous year rose by two from 2014.”
Syndicates reporting underwriting losses represented only about 12 percent of the Lloyd’s market’s overall 2015 allocated capacity of £26.1 billion.
Enhanced Central Oversight
Although the limited impact of catastrophes has generally helped the Lloyd’s market, S&P suggested that “enhanced central oversight has also aided syndicates in avoiding disastrous years over the past decade.”
* Lower combined ratios indicate better profitability. A combined ratio of greater than 100 percent signifies an underwriting loss.
 ]
]
Source: Standard & Poor’s