
It’s bad enough that property/casualty insurance companies are trying to fend off competitors in their own industry—and potential disrupters from outside—both vying to steal good risks away at lower prices.
Add to that an internal conflict within an insurance company’s ranks between the two functions that can make or break an underwriting profit and it’s no wonder that ROEs are sagging.
That’s essentially the assessment presented by Bret Shroyer, Solutions Architect for Valen Analytics, during a September webinar, “Failure to Innovate: What the Underwriter-Actuary Conflict Teaches Us.”
Shroyer, himself a casualty actuary, outlined the typical roles that actuaries and underwriters play in putting good business on the books. “Setting prices has traditionally been seen as the domain of the actuary,” but the second tool insurers have to garner underwriting profits is “smart risk selection. This is the art of underwriting—knowing whether to accept the risk under consideration [at] prices being set by the market.”
These two levers must be applied together. “If you’re using them in opposite directions, then you’re going to go in circles,” he said as a webinar slide showed an image of a hapless boater rowing the oars of his canoe in opposition.

“This isn’t a trivial finding,” said Shroyer, noting that the survey confirms the subtle—”and sometimes not so subtle”—tension that working actuaries and underwriters have felt for decades. Right now, however, pricing is more important than it has ever been before,” he said. “Thirty years ago, carriers could earn a 15 percent ROE by simply breaking even on the underwriting side with a 100 combined ratio,” he said, showing a graph displaying historical combined ratios, returns-on-equity and average investment yields from 1970 to 2012—with a high ROE of 14.5 percent in 1979, corresponding to an investment yield of 15.9 percent and a combined ratio of 100.6. Now with lower investment yields and lower leverage ratios, carriers are earning single-digit returns.
Consequences
Reinforcing the well-known financial reality that carriers simply have to be make a profit on the underwriting side to achieve higher overall return targets, Shroyer went on to review more survey findings and the implications for underwriting results.
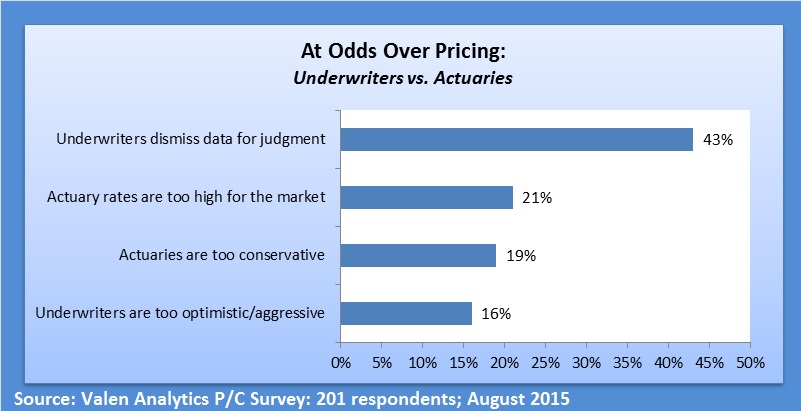
“By a two-to-one margin over any other response—people told us that underwriters are simply dismissing the data and the analytics behind the pricing and substituting their own judgment,” Shroyer said.
Judgment isn’t always on the mark, however, and can contribute to eroding profits over time—even when it’s informed by recent loss experience. Shroyer demonstrated this by describing the results of a recent Valen Analytics underwriting workshop, which pitted two teams of underwriters in an a game to win new business. Looking at two-year loss ratios of ten hazard groups, and noting that Hazard Group 4 had loss ratios that were half those of any other group, one team developed a rate-cutting strategy to target that group and win all that business.
The result: The loss ratio actually increased as a result.
A forward-looking “predictive model here could have told them that that was likely to happen. There’s nothing remarkable about Hazard Group 4 in the entirety. It just happened to have a good two-year result,” Shroyer said.
“In a perfect world, we want to be able to underwrite with precision. We want to match price to risk,” he said, illustrating how far off the mark carriers have been on the workers compensation line by overlaying a graph of pure premiums (loss divided by payroll) over actual accident year loss ratios for the industry for the years 1987 to 2012 (using data from Willis Re’s annual market cycle study). The loss ratios displayed a familiar cyclical up-and-down pattern with loss ratios plummeting in hard market years and soaring in the soft markets; the pure premiums, however, started dropping in the 1990s and the pure premium graph has stayed virtually flat since 1995.
“Losses are not driving the market cycles. Then what is? The answer is in the rates,” Shroyer said, then overlaying a graph of the rates moving in opposition to the loss ratio graph.
“Leading carriers are deciding where they want to play in the market cycle not getting pushed around by it,” Shroyer said, suggesting that a model that combines analytics with underwriting insight—not one or the other in isolation—can best match price to risk and allow carriers to make consistent profits regardless of the stage of the market cycle.
Cycle-Free Profits
Shroyer hammered home one particular point repeatedly—that neither analytics alone nor underwriter judgment by itself does the trick. It’s the two tools applied in tandem that help carriers maintain profits and break free of market cycle pricing.

Bret Shroyer, Valen Analytics
Here, he showed what is known as a lift chart—a chart measuring the difference in loss ratios for the best and worst risks predicted by a model—and demonstrated that underwriter judgment amplified the difference.
Building the lift chart, Shroyer first described a predictive model that gives a score ranging from 1-10 to every policy in a carrier’s portfolio—scored 1 for policies expected to have the best (lowest) loss ratios, and 10, the worst. One way to measure the predictive power of a model is the difference in loss ratio between bin 1 risks and bin 10 risks. “The larger that differential”—the lift—”the more predictive power the model has,” he said, comparing the predictive power of a model in an underwriter’s head, the predictive power of a straight analytics, and the average scores from both.
The results:
“This one study is indicative of results we see all the time,” he said. “We need to put this information in the hands of underwriters and actuaries so they can understand that they’re both a part of the final solution.
“Sometimes you can build a model that actually rivals the power of the underwriter at least on paper. But you can almost never beat the combination of an underwriter who’s using the model,” he said.
Carriers who understand this, and put it into practice, may help underwriters shake their fears about predictive analytics—fears that were apparent in the results of an earlier Valen Analytics survey. In that survey conducted in March, one quarter of underwriters surveyed said they didn’t trust predictive analytics because it might put them out of a job.
And actuaries need to overcome some of the inherently conservative biases they hold. The inherent conservatism of actuaries was validated by results of the more recent survey, which had 21 percent saying that actuarial conservatism is the root of actuary-underwriter conflict, and 19 percent saying that actuarial rates are too high for the market. Actuaries “need to trust that the underwriters are using these new data and analytics correctly and not just using them to push prices lower,” Shroyer said.
He outlined several steps to move the two groups forward to implement analytics in underwriting:
• Get senior level commitment. Start by defining specific business challenges.
Create an alignment on the strategy, goals and metrics to determine what success looks like, Shroyer said.
• Make the case for the organization. Outline the process with simple and compelling stories.
“Your people will support change with a solid roadmap and clearly defined success metrics,” Shroyer said, reporting his observations of carriers who have been successful. “It can’t be just about numbers and graphs though. There should be a straightforward narrative that explains why this is important for an organization—why it’s important right now.”
• Have transparency through the process.
“A predictive model shouldn’t be a black box. Explain what data went into the model,” Shroyer said, noting that underwriters who can interpret predictive scores are better able to guide discussions with agents and policyholders, and make more informed decisions.
Optimal Portfolios
He also suggested that carriers stick to small projects initially—test environments where they can involve people in the process from the beginning and can build on early wins.
So what do ultimate wins look like?
Among other things, there’s an opportunity to optimize profitability within a portfolio by focusing on the top 5 or 10 percent or the bottom 5 or 10 percent, Shroyer said, reporting on a study of client portfolios across multiple commercial lines of business—workers compensation, business owners packages and commercial automobile.
Valen found that the best 10 percent of the business—the bin 1 risks—accounted for 50 percent of carrier’s total portfolio profit, on average. At the other side of the scale, by getting off the worst 10 percent—a carrier would increase profits by 60 percent on average, the study across regions and sizes of different account sizes for these lines showed.
Maximum profitability occurs at roughly the 75 percentile, according to the analysis. In fact, “carriers could roughly double their profitability if they could eliminate all of the risks in bins 8, 9, and 10,” Shroyer reported.
“Keep in mind that these bin scores are predictions. They’re model scores. They’re not a measure of past loss ratio performance. These figures directly translate into results a carrier would have achieved if they were optimizing their portfolio size based on model score,” he said.